Advantages of the visual presentation of information. Visual attributes of displayed information
Have you ever wondered how we see objects? How do we snatch them out of the entire visual diversity of the environment using sensory stimuli? And how do we interpret what we see?
Visual processing is the ability to make sense of images that allows humans (and even animals) to process and interpret the meaning of the information we receive from our eyes.
Visual perception plays an important role in everyday life, helping in learning and communication with others. At first glance, it seems as if the perception is easy. In fact, there is a complex process behind the perceived ease. Understanding how we interpret what we see helps us design visual information.
Balanced infographics involve intelligent use of visual representation (eg, charts, graphs, icons, images), appropriate choice of colors and fonts, appropriate layout and sitemap, etc. And don't forget about data, its sources and themes, which is just as important. But today we are not talking about them. We will focus on the visual side of information design.
Psychologist Richard Gregory (1970) was convinced that visual perception depends on top-down processing.
Top-down processing, or conceptually driven process, occurs when we form a view of the big picture from small parts... We make assumptions about what we see based on expectations, beliefs, prior knowledge and previous experience. In other words, we are making an educated guess.
Gregory's theory is supported by numerous evidence and experiments. One of the most famous examples- hollow mask effect:
When the mask is turned to the hollow side, you see a normal face
Gregory used Charlie Chaplin's rotating mask to explain how we perceive the hollow surface of the mask as bulges based on our worldview. According to our prior knowledge of facial structure, the nose should protrude. As a result, we subconsciously reconstruct a hollow face and see a normal one.
How do we perceive visual information according to Gregory's theory?
1. Almost 90% of the information coming through the eyes does not reach the brain. Thus, the brain uses previous experience or existing knowledge to construct reality.
2. Visual information that we perceive is connected with previously stored information about the world, obtained by us empirically.
3. Based on various examples of top-down information processing theory, it follows that pattern recognition is based on contextual information.
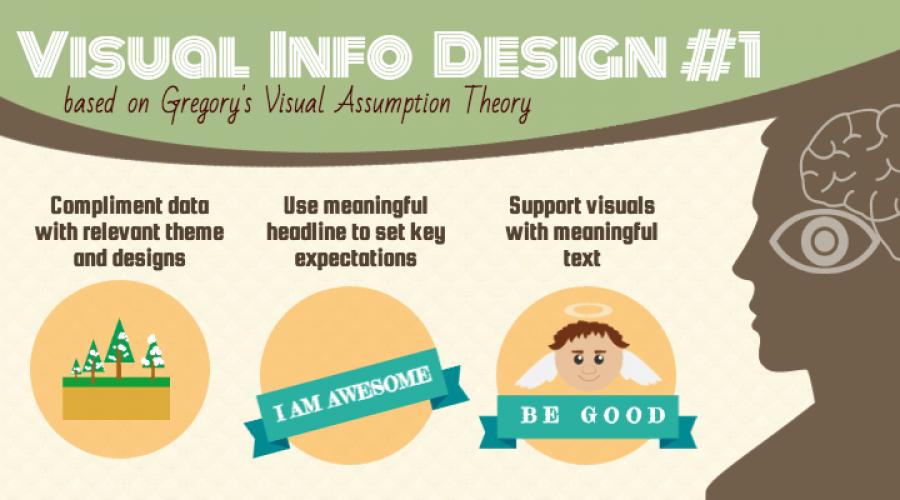
Information Design Tip # 1 from Gregory's Visual Assumption Theory: Supplement the data with appropriate theme and design; use a meaningful headline to set key expectations; support the visuals with expressive text.

2. Experiment of Sanoki and Sulman on color ratios
According to numerous psychological studies, combinations of uniform colors are more harmonious and pleasant. While contrasting colors are usually associated with chaos and aggression.
In 2011, Thomas Sanocki and Noah Sulman conducted an experiment to examine how color matching affects short-term memory - our ability to remember what we just saw.
Four different experiments were conducted using harmonious and disharmonious color palettes. In each trial, the participants in the experiment were shown two palettes: first one, then the second, which had to be compared with the first. The palettes were shown at regular intervals and several times in random combinations. The subjects were asked to determine if the palettes were the same or different. Also, the participants in the experiment had to evaluate the harmony of the palette - a pleasant / unpleasant combination of colors.
Below are 4 examples of palettes that were shown to the participants in the experiment:

How do colors affect our visual perception according to the theory of Sanoki and Sulman?
- People are better at remembering palettes in which colors are combined with each other.
- People remember palettes with a combination of only three or fewer colors better than those with four or more colors.
- The contrast of adjacent colors affects how well a person remembers a color scheme. In other words, this means that the color difference between context and background can enhance our ability to focus on context.
- We can remember quite a lot of color combinations at the same time.
Thus, the results of the experiment indicate that people are better able to assimilate and remember more information, perceiving images with a contrasting but harmonious color gamut, preferably with a combination of three or fewer colors.
Information design tip # 2 based on Sanoki and Sulman's experiment: use as little as possible different colors in complex content; increase the contrast between visual information and background; choose themes with a harmonious combination of shades; use disharmonious color combinations wisely.

Binocular rivalry occurs when we see two different images in the same place. One of them dominates, and the second is suppressed. Dominance alternates at regular intervals. So, instead of seeing a combination of two pictures at the same time, we perceive them in turn, as two competing for the dominance of the image.
In 1998, Frank Tong, Ken Nakayama, J. Thomas Vaughan, and Nancy Kanwisher experimentally concluded that looking at two different images at the same time, the effect of binocular rivalry arises.
The experiment involved four trained people. As stimuli, they were shown images of the face and the house through glasses with red and green filters. In the process of perception, there was an irregular alternation of signals from two eyes. The stimulus-specific responses of the subjects were monitored using functional magnetic resonance imaging (MRI).

How do we perceive visual information according to Tong's experiment?
- According to the MRI data, all subjects showed active binocular rivalry when they were shown dissimilar pictures.
- In our visual system, the effect of binocular rivalry occurs during the processing of visual information. In other words, for a short period of time, when the eyes look at two dissimilar images located close to each other, we are not able to determine what we actually see.
David Carmel, Michael Arcaro, Sabine Kastner and Uri Hasson conducted a separate experiment and found that binocular rivalry can be manipulated using stimulus parameters such as color, brightness, contrast , shape, size, spatial frequency, or speed.
The contrast manipulation in the example below causes the left eye to perceive the dominant image, while the right one perceives the suppressed image:

How does contrast affect our visual experience as measured by experiment?
- Contrast manipulation leads to the fact that a strong stimulus is dominant for a longer period of time.
- We will see the fusion of the dominant image and the suppressed part until the effect of binocular rivalry arises.
Information design tip # 3 based on binocular rivalry: n Don't overload content; use thematic icons; highlight key points.

4. Influence of typography and aesthetics on the reading experience
Did you know that typography can influence a person's mood and decision-making ability?
Typography is the design and use of typefaces as a means of visual communication. These days, typography has moved from the field of typography to the digital realm. Summarizing all possible definitions of the term, we can say that the purpose of typography is to improve the visual perception of text.
In their experiment, Kevin Larson (Microsoft) and Rosalind Picard (MIT) found out how typography affects a reader's mood and ability to solve problems.
They conducted two studies, each involving 20 people. Participants were divided into two equal groups and given 20 minutes to read The New Yorker magazine issue on a tablet. One group got text with bad typography, another with good typography (examples are given below):

During the experiment, participants were interrupted and asked how much time they thought had elapsed since the start of the experiment. According to psychological research (Weybrew, 1984), people who find their activity enjoyable and in a positive mood feel that they spent much less time reading.
After reading the texts, the participants were asked to solve the candle problem. They needed to attach the candle to the wall in such a way that the wax would not drip by using pushpins.
How do we perceive good typography and its impact?
- Both groups of participants misjudged the time spent reading. This means that reading was fun for them.
- Participants who were presented with text with good typography significantly underestimated reading time compared to participants who received text with poor typography. This means that the first text seemed more interesting to them.
- None of the participants who read the text with poor typography were able to solve the candle problem. While less than half of the second group coped with the task. Thus, good typography influenced the ability to solve problems.
Information design tip # 4 based on Larsen and Picard's experiment on typographic influences: Use legible fonts; separate text from images; do not overlay pictures or icons on the text; leave enough free space between paragraphs.

5. Perception of the essence of the scene according to Castelano and Hendersen
Have you ever wondered what the expression “one picture speaks more than a thousand words” really means? Or why do we perceive images better than text?
This does not mean that the image tells us all the information we need. It's just that a person has the ability to grasp the main elements of a scene at a glance. When we fix our gaze on an object or objects, we form a general idea and recognize the meaning of the scene.
What is the perception of the essence of the scene? According to Nissan Research & Development researcher Ronald A. Rensink:
“Perception of the essence of a scene (scene gist), or perception of a scene, is the visual perception of the environment as an observer at any given time. It includes not only the perception of individual objects, but also such parameters as their relative position, as well as the idea that there are other types of objects. "
Imagine seeing objects representing two signboards with symbols, and a diagram that symbolizes a fork and indicates two different paths. Most likely, the following scene appeared in front of you - you are in the middle of a jungle / forest / highway and there are two paths ahead that lead to two different destinations. Based on this scene, we know that we need to make a decision and choose one path.
In 2008, Monica S. Castelhano of the University of Massachusetts at Amherst and John M. Henderson of the University of Edinburgh studied the effect of color on the ability to perceive the essence of a scene.
The experiment included three different tests. The students were shown several hundred photographs (natural or human-made objects) under different conditions for each test. Each image was shown in a specific sequence and time. Participants were asked to answer "yes" or "no" when they saw the details corresponding to the scene.
Normal and blurry photos were presented with color and monochrome, respectively.

Anomalous colors were used to determine the role of colors in the perception of the essence of the scene for the following sample photographs:


How do we perceive visual information based on the findings of Castelano and Hendersen?
- The subjects grasped the essence of the scene and the target object in seconds. This means that people can quickly grasp the meaning of a normal scene.
- The subjects were quicker to establish the correspondence of color pictures than black and white. Thus, color helps us understand the picture better.
- In general, colors determine the structure of objects. The better the color matches the way we usually perceive the world, the easier it is for us to understand the meaning of the image.
Information Design Tip # 5 Based on Castelano and Hendersen's Scene Perception Research: Use appropriate icons or pictures to represent the data; arrange content in correct sequence; use familiar colors for important objects.

conclusions
Understanding how people perceive visual information helps improve infographics. Summarizing the findings of these experiments, here are some key visual design tips:
1. Layout and design
- The theme and design must match the information.
- Don't overload your page's infographics.
- Use themed icons.
- Place your content in the proper sequence.
- Use headlines to set key expectations.
2. Video sequence
- Visual effects should accompany the text.
- Show important numbers on graphs and charts.
- Use the right pictures and icons to represent your data.
- Reduce the number of colors for complex content.
- Increase the contrast between important visual information and the background.
- Use harmonious theme colors.
- Use disharmonious colors wisely.
- Use regular colors for important objects.
4. Typography
- Choose readable fonts.
- Leave enough white space between the title and the text or image.
- Do not overlay pictures or icons on text.
- Set sufficient spaces between characters.
Now that you know the ins and outs of creating beautiful and compelling infographics, it's up to you!
V.V. Tulupov
Today, journalists especially clearly understand that one should not neglect the design of a periodical, but nevertheless, among some, the opinion continues to prevail: when a newspaper is informative and interesting, is it worth paying attention to such "trifles" as its appearance and layout. Thus, short-sighted editors are deprived of another effective means of directing influence on the reader. Moreover, it has long been noticed: the emotional impact on a person is more effective than the usual verbal and informational; all the more so that modern visual chaos evokes a natural defensive reaction in the reader - he selects only those visual units that can arouse his interest (original designs, formats, fonts, color combinations ...). That is why designers are faced with a two-pronged task: to organize the video series of newspapers and make it the most attractive, vivid, individualized: after all, the external form already determines a certain way of perception of the newspaper and its difference from other types of printed matter.
When the reader perceives the content of the newspaper, we can talk about visual communication, since in this case the bulk of various information is transmitted by textual means on the widest scale, and the transmission is carried out in a visual way. At the same time, there is no need to preliminarily teach the reader some special way of perceiving information 2 - the reader is “taught” indirectly, through social practice, through a consistent offer of certain means of visual communication. Moreover, visual messages need to be streamlined - a modern person gets tired even with passive perception, since he involuntarily registers all visual messages in conditions of local concentration (in offices, in shops, on city streets, when he perceives outdoor advertising, advertising on transport, etc.) ).
Newspaper design is sensitive to changes in the nature of journalism, in the content of print materials. The percentage of publications of information genres has increased - there is a need for the visual organization of a large number of notes, reports, interviews. The volume of publications increased, and this entailed an update external appearance newspapers that are typeset on the basis of a "strip-by-page" thematic structure. The volume of information consumed by the reader is rapidly growing 3, and the designer is faced with a practical task - to be able to distinguish a newspaper from a number of others, to focus on as many materials as possible. Since our ever-hurrying contemporary begins to read through the newspaper (sometimes limiting himself to this), it is important to "catch" his eye, to highlight at least the most important and essential. Someone and such "purple" information is enough, but for someone the accented design serves as a kind of beacon, leading the eye from important to more important. Thus, the intensity of newspaper graphics, the dynamism of visual compositions are in demand today.
It becomes all the more important that designers realize their responsibility to the readership, surrounded by an essentially aggressive visual environment. Today, the load on the eyes, the psyche of people sometimes goes off scale for the risk "Dangerous to health!" Special effects (one of the newest is segmented screening) used on television can adversely affect viewers' eyesight. Eye movement, according to doctors, is disturbed if a person is in an unfavorable visual environment. Video ecologists - representatives of a new scientific direction - are engaged in the definition and study of negative (aggressive visual) fields.
Modern newspapers also often show examples of the negative impact on the vision of readers when designers use annoying - literally and figuratively - the same type of geometric shapes. After all, when a person sees many identical objects of two diametrically opposite color ranges, for example, parallel black stripes on a white background (the so-called "striped vest"), his eyes jump like mad. They are forced to continuously record the transition "white-black", "black-white", while the attention is defocused, the brain is continuously "bombarded" with impulses. If you look at such a picture for a long time, it will lead to fatigue, headaches, irritability. " 1 Newspaper layout designers, using the capabilities of the computer, began to abuse the so-called "inversions" - white letters on black. It is even more difficult to perceive text on a gray background, especially when a font is used in light, rather than bold (bold) type. In general, newspaper ornament, that is, a combination of a text field, spaces, black and gray planes, is becoming more and more aggressive, and from an aesthetic point of view, also eclectic. Small sizes of text and overly large title fonts are not optimized, but zat- " ruin the process of semantic perception of visual information. Nuances, graphic pauses are ignored, and after all, the use of these techniques is not only an indicator of the class of designers - without them the process of perception is truly nervous. Especially when you consider the huge size of the pictures, the ever-increasing number of montages, collages on the front pages of newspapers and the covers of tabloids, magazines, internal pages- in the design of heading complexes of voluminous publications. Another problem is multi-headset. One gets the impression that other designers have decided to reproduce literally all the fonts in computer libraries. Possibilities modern programs Layouts are great, if not limitless, but when changing the size, spelling, filling of letters, you should remember about the sense of proportion. Good taste is a sense of harmony. It is harmonious compositions that correspond to the human nature of perception.
Psycholinguists use the term "semantic perception" in connection with speech communication. Undoubtedly, the perception of visual information is characterized by the process of comprehension, which has an effective side (understanding - misunderstanding): "... Being the awareness of an object, a person's perception normally includes the act of understanding, comprehending" 1. Consequently, we can talk about the semantic perception of visual information in a newspaper (visual information in a newspaper is all the elements of a newspaper form visible to the eye, obtained when paper and printing elements of a printing form come into contact; spaces can also act as visual units).
If the reader is offered prints of printing materials (for example, rulers), then the perception will be carried out at the simplest level. recognition. Some geometric shape formed with the help of the same rulers (in a newspaper this is most often a quadrangle or a right angle), the reader will perceive it differently - at the level legibility. When the internal space, bounded by a frame, fills a newspaper message with a corresponding heading complex and structured in a certain way (lead, afterword, headlines, chapters, etc.), the reader's perception will flow on the very high level- level semantic perception.
The reader can also attribute the shortcomings of the form to the content. Moreover, the underestimation of the importance of the processes of shaping by the editors most often leads to the poverty of the content of the newspaper. And the lack of content always affects the external face of the publication. This is also the manifestation of the universal law of the unity of content and form. Among the factors influencing the perception, memorization and acceptance or rejection of the transmitted information (general assessment by the audience of the public usefulness of a certain means of conveying information; adherence to moral and ethical standards prevailing in the audience; maintaining group prestige, etc.), Yu. A. Sherkovin highlighted the following: reaction to the style and presentation of information 2. Naturally, the role of design in the reader's perception of a newspaper should be assessed only when there are favorable conditions that optimize this process: the reader has enough knowledge to become interested in the materials of this newspaper, to understand and assimilate them; for the reader, these materials are valuable new interesting (useful, cognitive) information. That is why it is very important to position your newspaper for a certain part of the audience, clearly representing its needs (motives, needs, interests, attitudes, stereotypes). her intellectual level, life experience (practical training), giving the materials an appropriate literary form, choosing a certain tonality of design. For example, it is obvious that the reader of youth newspapers is extremely unstable, his character, tastes and preferences have not yet been finally determined, and therefore it is extremely difficult to “catch an eye” in the process of visual communication (E. Lissitzky's expression). The peculiarity of this reader also lies in the fact that in the process of visual communication he has the highest level of "conditional independence" in the "read - not read" attitude. And since design does not just present information, but at the same time convinces, having the same elements of suggestion, it is clear how much the requirements for its ideological, semantic and aesthetic sides are increasing.
Let us turn to the process of the reader's perception of a newspaper form, which imperceptibly brings the content to the reader's mind (it seems to a person that he perceives the content directly). It is clear that no one specifically teaches the perception of design, but this process is carried out in an informal way - through the past experience of people for whom reading newspapers, not only local, but also central, has become an everyday need. "Psychological processing of information is schematized to the extent that it is due to the joint influence of internal and external factors, regardless of whether you are aware of it or not" 1. To external factors we refer everything that is happening around the reader at a given moment in time, to internal factors - everything that happens inside him at the same moment (past knowledge and experience, attitude to this newspaper, this problem, this genre, this author , the momentary state of his health, "psychological baggage" - beliefs, delusions, opinions, etc.). These factors are periodically - both consciously and unconsciously - processed by a person, and as a result he acts one way or another: he looks through the newspaper, begins to carefully read the material that interested him, postpones reading for later ...
Sensory perception formally precedes the main stage of semantic perception - the process of analyzing and synthesizing the information received.
At the first stage, visual information is instantly perceived. But in the newspaper there is also a text that sets a certain order of reading, its composition is not fully realized instantly, but only after the end of reading. Thus, the text presented in the newspaper “is simultaneously perceived both as the text itself and as a visual sign, that is, in conflict” 1. It is appropriate here to give a characteristic of the nature of our perception, which is given by V.A. Favorsky. The well-known graphic artist and book design researcher says that this nature is in a sense full of conflicts: “The conflict between the plane and the space that is depicted on it. Conflict of plans - what is the main one? Conflict of subject and space, conflict of color and volume, etc. " 2. Further, he clarifies: an artist (here - a designer) must see and resolve conflicts, leading them to integrity, organize a queue of watching. By organizing the movement in the newspaper, the designer also organizes the memory of the reader.
Optimality of perception is reduced by the presence of interference - a combination of factors that can interfere with the reception of a message. Among them - “the lack of a non-linguistic context (the absence of a communicator, and this is an obstacle to comprehending the content) and often one-time perception due to the lack of time and the lack of an attitude toward perception” 3, as well as: poor typographic performance of the entire newspaper issue, incomprehensible material configuration, font and many other factors, both technical (the possibilities of editorial techniques and the printing base) and subjective ones (mistakes in layout, mistakes of the layout designer, proofreader, number on duty - up to the work of the post office).
To reduce the amount of interference to a certain minimum allows modeling the newspaper as a whole - the structure of the editorial staff, the work of the editorial team, the issue of the issue, the external face of the publications, etc. For example, compositional-graphic modeling optimizes the perception of newspaper content mainly due to the stability of a previously thought out, aesthetically verified external expressions. It is during compositional-graphic modeling that a kind of "training" of the reader in the perception of newspaper design takes place. The erudition of modern people (knowledge in the field of architecture, applied graphics, etc.), reading and viewing experience allow them to approach the design of a newspaper with the strictest standards. And even if the reader cannot explain either to himself or to you, what are the mistakes in the design of this newspaper, he can still easily distinguish between a reasonably and accurately, lovingly designed edition from an ill-conceived in terms of form, sloppy edition.
Among the hindrances that reduce the optimality of perception, we named the lack of a perception mindset. What is this - installation? It is most correct to characterize it as an integral state of the subject, a state not conscious, but still representing a "peculiar tendency towards certain contents of consciousness" 1. This is the final psychological product of informational influence, the state of internal readiness of the individual as an integral subject for a certain actual action.
We have already noted that reading a newspaper for a modern person is not even a necessity, but a need. On the pages of "his" newspaper, he finds materials telling about the political, social, personal life of people, society as a whole. The reader can come, call or send a letter to the editor - ask a question, criticize, talk about painful ... With today's typological diversity of the press, there are all conditions (ie needs and situations) for the manifestation and "education" of the reader's activity - this is both "a method that guarantees us the means of satisfying needs" and "a source that makes it possible to directly satisfy them" 2. A similar quality grows on the basis of a fixed mindset.
If the reader has a certain orientation towards the design of a given newspaper, if it is fixed sufficiently firmly, and we will also update it constantly, then you can see that a certain form will orient it towards a certain nature of the content (here we are dealing with anticipatory reflection) ... The depth of design impact will be achieved only when the opinions of the recipient (reader) and the communicator (newspaper) converge as close as possible. In this sense, the concept of attitude coincides with the concepts of stereotype (the term of the American publicist and sociologist Walter Lippmann, introduced by him into scientific circulation in 1922), predicted expectation, an acceptor of action, etc. 3. The specificity of the attitude (stereotype), the strength of its influence on decision-making depend on the effective (scientific, aesthetically verified) compositional-graphic model.
The difficulties that designers face arise from the specifics of the newspaper as a technical means of communication. This specificity is manifested in the absence feedback at the time of the communication process. Therefore, the staff of the secretariat, designing the pages, first of all put themselves in the reader's place. As a director, according to V. Meyerhold, in essence, ideal viewer and a graphic designer is an ideal reader who compares the logic of the compositional and graphic constructions of the strips with his own experience of the newspaper reader (in parentheses, we note that focusing only on the subjective factor is a rather dangerous path, since the designer's attitude may not coincide with the attitudes of the bulk of the readership audience; today, in conditions of real competition, the editorial board simply needs to order or conduct special specific sociological studies of target groups of influence). Without leaving the given concept, designers are looking every time for new ways of design, improvise within the model and thus activate the perception of readers, causing them a pleasant feeling of surprise, two of the many psychological effects of any mass communication - emotional and aesthetic - are directly related to design. one .
A separate issue is only a part of the newspaper, deployed in space and time, and therefore everything new should not come into conflict with the existing design system in this newspaper. In practice, this is what happens: traditional ways in the presentation of the newspaper's video sequence dominate regardless of the subjective decisions of the designer, especially since the subordination of the design to the content, which is characterized by greater stability in relation to the form, as well as the minimum time devoted to the design and layout of newspaper pages, and other reasons make designers stick to consistency in newspaper composition and graphics. But if the design policy is not fixed in the document (descriptive and physical models), is not entered into the computer memory (styles), subjective decisions will be more than the norm, and this destroys the attitude towards receiving newspaper information. By the way, according to psychologists, when meeting with a friend, the reader enjoys recognition and easily transfers him to a recognizable object, and this object (in our case, a newspaper message) is perceived faster. Thoughtful compositions, successful graphic solutions (the presence of a certain design idea of a collection, a page, a number, a newspaper model), perceived (understood) by the reader, contribute to the emergence of a sense of satisfaction and even involvement in the process of creating, designing and transmitting information - this is a kind of "co-creation" journalists and the audience at the level of "form awareness".
Practice shows that it is wiser to try even the sharpest turns in the design line of a publication in some special issues (thematic, festive, if possible, in special experimental issues), so as not to destroy the reader's understanding of the newspaper's policy in ordinary issues. It is advisable to introduce approved innovations from the beginning of the year, when the reader, by tradition, has an attitude towards accepting something new. By this time, the newspaper model should also be adjusted, taking into account the changes caused by the requirements of the day. This is also explained by the fact that the annual set of the newspaper should be considered as an integral organism.
So, upon perception, the reader's attitude to accept or reject the message is actualized. And since the reception attitude must be reinforced (otherwise it will collapse), undeservedly pulling out weak materials through design can undermine the reader's confidence in the newspaper. The design challenge extends even further: it is necessary to break the rejection mindset. This happens when the design attracts the reader, "forces" him to start reading. Even if a newspaper report interests him, this does not mean at all that the next time the reader will certainly turn to such materials. But since a stable design does gradually shatter the rejection mindset, it is wise to produce such positive perceptual effects through repeated repetitions. This is also possible: the material captures, captivates the reader, and immediately after reading it, he has an attitude to receive such messages. The next time, familiar design can serve as a signal to start reading, and engaging content can help strengthen the reader's reception.
We find approximately the same in psycholinguists, who assert that the basis of the psychological scheme of semantic perception is the establishment of a connection between visual units and semantic links: the case proceeds instantly. If such a connection is established for the first time, then its establishment is mediated by the reproduction of connections already existing in the past experience, their grouping, the identification of similarity-difference, etc. In this case, understanding may take quite a long period of time, and in some situations it may not be achieved ”1. That is, the actual and fixed attitudes do not contradict each other, moreover, the first, having arisen on the basis of new situations and the needs of the subject, under favorable conditions develops into the second.
All of the above will not be valid if, in the process of communication, the main condition for the effectiveness of the influence of the press as a whole is not observed - attention. That is, it is necessary to achieve an intrapersonal, psychological orientation of the reader to a certain subject (newspaper, issue, page, selection, separate material) and maintain this orientation even with the weakening of external "irritation".
After attracting attention, it is important to hold it. which is possible only if the design and form of the newspaper message are adequate to its specific content, when the content is interesting to the reader. Only then does contact arise, understanding as a result of meaningful perception of a message. The instability of the attention of the modern reader poses special tasks for journalists to win over their readers. Of the three forms of attention - involuntary, hypnotic, conscious - the last, the highest, has a direct connection with the problem of understanding the directed, targeted impact of mass media.
For effective perception, it is important to establish the correspondence of the “anticipatory image” with the receiving signal. Therefore, it is necessary that the reader is familiar with the design concept of his newspaper, imagining its "face" (image, image). The stability underlying compositional-graphic modeling contributes to the accumulation of "design knowledge" in its reader (modeling is a kind of way of imperceptible "learning", "education"). In the process of perception, evaluation always accompanies cognition: logical and evaluative are inextricably linked, logical is always inherent in evaluative judgment.
The reader, receiving visual information, isolates it from the entire system of objects of perception; unconsciously (but maybe consciously) correlates it with past experience; "Gives" a general, and then a specific assessment of this information, as well as the information surrounding it. Then perception rises to the last level - understanding the meaning of visual information, design idea as a whole. Thus, the stability of topics and problems, as well as the appearance of the publication, optimizes the process of semantic perception of the newspaper.
But any stability is in constant conflict with the rapidly changing opinions, tastes, likes and dislikes of the readership. In our opinion, it is this contradiction that is productive - designers must keep up with modern achievements in the field of aesthetic culture and correct - educate - the tastes of the audience, increasing its aesthetic education. The more consistently the designers are in their efforts, the more successful this process is. And then the true, lasting trust of readers in the newspaper arises.
If a newspaper stands out against the background of others by its form, then in the conditions of a certain deficit of aesthetically verified and purposeful visual information, the efficiency of its perception increases. At the same time, suggestion acquires special power - and not only at the level of information content, but also at the level of the very form of its presentation. Until recently, newspapers had a reputation for reliable reliability in the minds of our readers, but the credit of trust is rapidly declining. This is largely due to the bias of certain newspapers, specific journalists, the mass of ordered materials, but it is very important to give an objective integral picture of the world, to direct the direct and spontaneous reflection of reality in the minds of readers "in the mainstream of a systematized, theoretically grounded and rationally comprehensible worldview" 1 by beliefs and suggestions.
The specificity of readiness to perceive information products is expressed in a clear orientation towards a certain content and form of its presentation, and, possibly, towards a certain author. Readiness for perception is formed and maintained by a system of permanent headings, a stable design (planned readiness). Even more pronounced character will be ready to accept continued publications. “The readiness to perceive some messages (or their aggregate) for the purpose of their logical comprehension and regardless of the external conditions in which communication takes place, can be designated as“ persuasion ”. The readiness for uncritical perception of messages under the direct or indirect influence of external conditions - the prestige or pressure of the group, for example, - should accordingly be called "suggestibility" 2.
It is worth dwelling in more detail on two undifferentiated methods of bringing the meaning of the content to the consciousness of the reader: the main one - persuasion and the auxiliary one - suggestion.
First, one can rightfully speak about the "inspiring power of persuasion": "... The audience's absorption in the logic of arguments in the process of persuasion, the penetration of logic not only into consciousness, but also into feelings creates a qualitatively new effect - the effect of suggestion" 3. The order itself, the original and logical system of elements can evoke positive emotions - satisfaction, surprise, etc. (compare: "paradoxical move" in a chess game, "witty solution", "elegant formula" - in mathematics). The design of newspaper information, undoubtedly, should have an internal logic. The very consistency, rationality of the compositional and graphic ensemble of the newspaper, based on the laws of proportion, contrast and rhythm, convinces the reader. Consistency is also inherent in KGM, and therefore the latter contributes to the evidential presentation of judgments, that is, to beliefs.
Newspaper design has an inspiring power: after all, suggestion can take place "when it comes ... about simple cultural norms, about stereotypes that express complex phenomena of social reality in a simplified form" 4. The mechanism of repetition contributes to the effectiveness of suggestion (at the same time, one should not forget about the elements of novelty in the familiar, recognizable appearance of the publication). It is worth clarifying: we * mean that suggestion, which is based mainly on a sense of respect, trust in the one who inspires. It can only be carried out on a regular basis when the reader's confidence in the newspaper is evident, when the reader is aware of himself as a part of a large audience participating in the process of reading his (their) newspaper. "Moreover, thoughts and feelings born of suggestion are clear and categorical, require actions, as if they arose not indirectly, but as a result of one's own observation and cognition of the suggested."
When a designer, using a number of techniques, highlights a particular material on a strip, he uses elements of suggestion, the effectiveness of which in conditions of a shortage of visual information (or high-quality visual information) increases significantly. The process of suggestion and design can be of two types: D) the use of a minimum of design means in the case when the newspaper material itself has one or two characteristics that allow it to stand out on the page, such as: large volume, signature famous author, permanent place in the newspaper; 2) the use of a set of design tools that cause the reader's aesthetic satisfaction. And here "not only the content of the information, the external circumstances of its perception and the prestige of the communicator, but also the very form of presenting the material acquire an inspiring power ..." 2.
To better represent the process of the reader's perception of the form, let us dwell on the concept barrier - a set of various factors that affect the perception process, have the ability to direct and condition the individual's reactions to the perceived, and thereby can increase the effectiveness of the message's impact on the reader 3.
The design of the newspaper is in a sense a barrier, passing which the message not only does not lose in perception, but also wins. When the newspaper form is perceived as a barrier, general erudition, and aesthetic preparedness, and the reading experience of people can act. With a stable design, the reader spends less energy looking for the desired messages, and understanding the newspaper's line, the logical design brings him a certain satisfaction. In this case, the barrier plays a positive role, contributes to the consolidation of the attitude towards the reception.
Barriers ("concomitant factors") that are associated with and affect newspaper design are the reader's predisposition to perception, group norms, interpersonal contacts, customs, traditions, and national characteristics ... There is a case when English readers not accepted at first Soviet newspaper, published in London during the Second World War in English, only because it repeated the layout of our newspapers.
It is very difficult to find qualitative criteria for the conditions of perception and assimilation of the meaning of a newspaper message, therefore journalists must carefully study the experience of designing the best Russian newspapers. In doing so, it is important to know the ways to overcome obstacles identified by psychologists and researchers of journalism. For example, designers use small print to type texts of secondary importance. But just such texts are given to the reader with tension, and he involuntarily focuses on them. True, the constant use of this technique has led to the fact that the reader already understands: the text typed in nonparelle does not play the main role. Studies have shown that “if all the text is typed in bold, then the reading speed remains unchanged, if it occurs in ordinary text, it attracts the reader's attention, slows down the reading speed. If the reader gets used to the bold type, the reading speed increases again.
The larger the line, the more commits (stops) the reader makes, the slower the reading speed. "" We can conclude that font and format highlights are very effective, but they should not be used too often and too intensively: this hurts readability, and also creates variegation, interfering with the normal understanding of the meaning of the content and violating the elegance of the appearance of the strip.
A few words about print quality. It is clear that only the maximum optical clarity of newspaper stripes can serve as a directional effect of the design. A bad print makes it difficult to read, irritating the reader, hides the positive aspects of the layout, visual units - contributes to the destruction of the reception set 2. The concept of readability - one of the conditions for reading productivity - is broader than the concept of visibility, “since readability is significantly influenced by such factors as the psychophysiological characteristics of the reader, his fatigue, qualifications, and profession. The visibility of the font depends only on the quality of the font design itself and on the peculiarities of the reader's vision. Readability is influenced not only by the drawing and font size, but also by a number of conditions associated with the specifics of the design of printed material, for example, different material ratios, location on the page (line length, line spacing, letter spaces, type of text layout of the publication), paper color, printing method, etc. " one .
Based on research by readability scientists, a number of specific conclusions can be drawn about newspaper design:
It is preferable to use a “Latin” type font, a serif font (for example, a new newspaper typeface) as the main text font; this rule holds true even when switching to smaller fonts - from petite to nonpareli, etc .;
When communicating to a less qualified reader, it is very important to preserve the typeface features of the text font, since their influence on a specific audience (children, youth, rural readers) is quite large;
It is ineffective to read excessively short and excessively long lines (in newspapers, formats from 2.5 to 4 squares are preferred; non-standard ones should not exceed 6 squares);
The speed of reading (more broadly - perception) is facilitated by short headings;
In the heading complex, a consistent change of pins is important. Turning to the psychology of perception, we tried to trace,
how newspaper design, "resorting" to rational and emotional impulses, contributes to the achievement of the effect of information impact. Knowing that the final synthesis of impressions from the perception of the visual information of a newspaper arises only as a result of correlating all units, it is necessary to proceed to the consideration of visual information in the system of composition and graphics of a strip (number, set of numbers), to the concept of “aesthetics of a newspaper page”.
When designing newspaper pages, the responsible secretaries choose a specific compositional system. The overwhelming majority of newspapers adhere to a straight, mixed (combination of vertical and horizontal structures), asymmetric layout. Traditions and modern trends in the design of the newspaper, the requirements for the prompt release of the issue objectively dictate a simple, reasonable and at the same time informal way of arranging materials.
Most local A3 newspapers today choose a six-column layout. Its advantages are obvious: firstly, with a six-column layout and typing on 2 1/4 squares, newspaper space is saved (compared to a set of 2 1/2 squares), and secondly, there are many more options for compositional placement of materials - layouts are not repeated, which naturally enlivens newspaper pages and makes them attractive. But six-column layout alone does not provide advantages, you have to find them. And some designers still “cut” the pages in half, “sculpt pies”, leave no room for dividing lines, frames - b In this case, it is necessary to reduce the width of one of the columns. It turns out that other newspapers, although they are typeset in the old way, with 5 columns, have a more attractive appearance. They have their own benefits: increased gutters between columns allow you to freely maneuver with rulers, other typesetting-graphic elements, etc. But - and this should be emphasized - the use of a 2 1/2 square column leads to the fact that readers receive less than 200 lines of newspaper information in each issue ...
The optimal number of columns on a page of an A2 format newspaper is eight. Rarely do designers choose a nine-column layout, and even less often a ten-column layout (this is how Vechernyaya Moskva was designed in its time). At the same time, it is impossible to reduce the intercolumnar gaps too much (at least 8 points), use frames very carefully. Otherwise, having won in one (there is a possibility of building more dynamic compositions), you can lose in another - in readability.
The fact that qualified secretaries vary the typing formats rather carefully, contributes to the creation of rhythm on the newspaper page, complies with the principles of compositional-graphic modeling, and accelerates the prototyping processes. And yet, it is absolutely necessary to use additional formats in some specific, pre-agreed cases: when typing especially important editorial materials that go under constant headings and located in a certain place, captions to photographs, "sidebars", "take-offs in the text", conclusions etc. Without all this, the newspaper space looks like a solid gray mass, the eyes of readers get tired, moreover, they find it difficult to distinguish the main and the secondary when reading published materials - the design of the newspaper does not fully fulfill its commentary role.
Effective remedy dynamic architectural solutions of the strip, methods of grouping materials in order to emphasize their connections and optimize the semantic perception of visual information is and proportion. Eye-pleasing proportions in the newspaper are approaching the "golden ratio" and are 21:34 (0.61803). More Renaissance artists used golden ratio in the compositions of his paintings, considering it an ideal expression of proportionality. Indeed, in nature itself there is such a strict correspondence: for example, in sunflower baskets, the deviation from the golden ratio is only four thousandths of a percent, the number of spirals in a round cactus going clockwise and counterclockwise is 34 and 21 (!) ". When creating newspaper graphics, you should also not violate this ratio too clearly. But, relying on traditional proportions, designers should not avoid changing them - the change of proportions, as well as the techniques of asymmetry, determine the dynamics of the stripes.
The proportions prevailing in the newspaper serve the unity of the composition, and ultimately - the creation of an integral organism of the newspaper. Each particular newspaper has its own favorite proportions (some designers prefer three-column columns - from top to bottom on the right, others - two-column columns, still others cover materials by 5, 6, 8 columns, 60 petite lines high with a "basement" on the 2nd, 3rd , 4th stripes ...). The given proportions determine the stability of the size of publications, sections of the newspaper. Often, editors set an upper limit on the size of publications (in large-format newspapers it is equal to about 300 typesetting lines), which allows maintaining stable proportions and even serves to improve the skill of journalists who seek to express their thoughts in a concise form, in precise words. If multi-page materials are balanced by notes, small reports, interviews, correspondence, this means that the designer used an effective method from the point of view of semantic visual perception - a change in proportions.
Both symmetry (asymmetry) and proportion create a certain rhythm in the composition of the newspaper, which serves to organize the movement and stops of the reader's eyes. Rhythm and meter along with the volumetric-spatial structure, scale, proportion, contrast and nuance, symmetry and asymmetry, color, are the most important form-building categories (means of composition). The metric structure of the form assumes uniform movement, alternation of identical elements; rhythmic - is the result of uniform accelerated or slowed down movement, alternation of elements. “The metric row is characterized by the fact that separate equal parts are placed at equal intervals (simple row). With the help of it, rigor and poise are achieved. Compared with simple next, the rhythmic row is more mobile, tense, more interesting. It is more lively, gives an opportunity for further development and therefore is used by designers to express movement ”1. Rhythm (from Greek - proportionate, harmonious) "is the most essential moment in the formation of the integrity of any work, regardless of what channels (visual, auditory, tactile, etc.) it is perceived" 2.
Columns of text are the metric basis in the newspaper, and the horizontal movement of the eyes is crossed by the vertical one. Distribution of attention on a mosaic newspaper page, in general, is chaotic - the organization of attention and design serves (design is always order). Yes, and each reader perceives the newspaper in his own way, and not strictly from the first to the last page, from the top to the bottom of the materials - exaggeration, selectivity of reading are specific for readers of periodicals. Rhythm is based on repetition, it is characteristic of all elements of newspaper design. A special place here is occupied by a linear rhythm, which is distinguished not only by repetition, but also by a certain periodicity. In general, rhythmic repetition has a rather complex expression - it is repetition with elements of novelty. There are dynamic and static rhythms - the first is more typical for the design of children's, youth, tabloid, the second - for high-quality socio-political newspapers.
The newspaper strip is built on contrasts, text materials are adjacent to illustrative materials, which, in turn, break down into dashed and tone materials; an information note is also required in a newspaper, as is correspondence and an article (contrast of big and small); journalistic materials are interspersed with statistical, literary and artistic, reference and others; positive - critical; editorial - official, advertising, etc. Designers, in addition to the already mentioned contrast of large and small, consciously or intuitively use the contrasts of horizontal and vertical, wide and narrow, “black and white” (and sometimes additional) color, black, gray, white and color. In a newspaper, “dark” parts are large headlines in bold (chopped) type, dark pictures, dense text blocks; "Gray" parts - individual texts, background; "Light" - parts of the strip containing a small amount of text (white space is called "air"). Some newspapers prefer a contrasting design, others a weak contrasting design.
Contrasts should be used carefully - so that they do not violate proportions, balance and rhythm on the strip. Apparently, it is worthwhile to think over the use of contrast in advance, fixing its main manifestations in the model: to determine several schemes for the compositional placement of materials on certain strips, based on their subject matter and dimensional characteristics; choose one or two basic text fonts (and heading ones too) and one or two additional ones; fix a certain group of rulers, among which also highlight the main and auxiliary ones; set the size of gutters between illustrations.
Some people understand newspaper design primarily typography. This has its own reason - most of the newspaper space is occupied by fonts: text and heading, typesetting and drawn. “The font plays not only the role of an informative, communicative means, but it is a carrier of aesthetic information. Hence our requirement for a typeface that, along with legibility, it should be beautiful, so that the shape of the letters pleases the eye and gives aesthetic pleasure. ”“ A special place is given to the headline fonts, since the design of the newspaper “guides” the reader's attention mainly with the help of headings. the process of semantic perception of visual information into stages, it can be assumed that the main heading will be a semantic stimulus for the reader, and the pictorial elements that form a complex with the heading (screensavers-symbols, photos) - a visual stimulus, and the latter precedes the semantic stimulus, and together they optimize the process of perception as a whole.
Content is primary to form. This is an axiom. But how, for example, do you use fonts depending on the content of the text? After all, there are no strict rules that would determine the semantic meaning of fonts, just as there are no precise rules that determine the meaning of dividing lines, etc. The statement “the size and design of the font indicate to the reader the meaning of the material” can do little to help the designer. Of course, the size of the headline font depends on the meaning, the degree of importance of the newspaper message, the size, the place where it will be spread, as well as the number of columns given for it. In such cases, the practitioner determines the size of the font by eye. But what about his drawing, style?
For each time, certain fonts are characteristic: in the Middle Ages, Gothic fonts dominated in Western European countries, in Russia - Church Slavonic. Then, from the 15th century in Europe, from the 18th century - in Russia, serif and civil type fonts, introduced by Peter I in 1710, began to be used, respectively. The Russian type school was influenced by the fonts developed in French and German type foundries, which led to some convergence of the graphics of the Russian type with the Latin. By the beginning of the 90s. of our century, the domestic library of typographic fonts consisted of more than 300 typefaces and contained a full range of fonts intended for a set of all types of printed publications (for example, for newspapers such typefaces were recommended as "New newspaper", "Newspaper chopped", "Newspaper Trudovskaya", "Asterisk", "Norm", etc.). With the transition of editorial offices to computer technology for publishing newspapers, the demand for computer fonts has increased. Unfortunately, there are a lot of Russified font handicrafts. “This is done simply: from the catalog of any foreign company, a favorite font based on the Latin alphabet is selected and drawings of the Cyrillic characters are added to it at their own discretion. The resulting set of characters is packaged in the appropriate format (HP PCL or PostScript, True Toure) and offered for sale as a new font. For greater significance, the name of the font changes, although in its graphic character and other features it differs little from the original source ”1. Naturally, newspaper design should use professionally designed fonts that have basic legibility-based leading that provides optimal line density and a normal text experience. These fonts are not only technological and economical, but simply beautiful (their creators, coming up with original drawings, scientifically calculating the proportions of letters and signs, relied on the entire experience of font art).
Any font has some abstract meaning - relation to a certain historical period of time, softness, hardness ...
But this is largely a subjective view of its nature, which also presupposes high taste, artistic skill, and a deep knowledge of the aesthetics of type in every designer, journalist-graphic designer. If they do not possess these qualities? What if there is a constant rush to publish a newspaper?
It is more reasonable, relying on the tastes of the editorial staff and the printing house, on the rich experience of designing the best newspapers, taking into account the traditions of your newspaper and the possibilities of the printing house where it is printed, conventionally divide the fonts into groups by meaning. Since they will be consistently used in a newspaper in a particular context, readers are bound to have an understanding of the commentary meaning of different fonts. The order in the type economy will also serve the type harmony of the newspaper, and will minimize errors in the use of type during urgent revisions.
Interestingly, designers are often hindered not by the lack of text and heading fonts, but by their ... excess. In an effort to "beautify" newspaper pages, they use the entire "font library". As a result, outdated and modern, chopped (grotesque) and literary (Latin), prohibitively large and extremely small fonts can "argue" on the stripes.
It is best to use in headings only two or three universal fonts, similar in style, vary their size, the angle between the main strokes and the imaginary line on which they stand (straight - italic), the ratio between the width of the letter and its height (normal - wide - narrow), uppercase and lowercase spelling, ensuring that all types of headings (elements of the heading complex) are in harmony both on the page and in the number. This design of headings is called small-heading and assumes the presence of a font schedule. There are two other approaches that designers now tend to abandon: single-type design (typing an entire newspaper in the same typeface, using different typefaces and spellings) and multi-type design.
In some newspapers, headlines are set extremely inexpressive - often the title of a major publication does not differ in any way from the title of a short note on the same page. The situation is especially unfavorable with the headings of materials in collections, typed in completely different fonts. Sometimes there is too much "air" to the left and right of the headlines. There is no system in the presentation of headings: they are typed either in an uppercase text font, or in a heading font, which rivals the main heading in size (!). Often, titles are typed in capital letters. There are errors in the calculation of the heading area, there are many repetitions of words in the names, even on one page. Somewhere it is customary to put titles above the pictures. But this is far from always justified - often the titles are too detached from the beginning of the text. It happens that they cut the text so that its upper part is perceived completely autonomously.
Hand-drawn headlines are rarely seen in local newspapers, due to disabilities their printing houses, and, apparently, it is difficult to involve good type designers in permanent - and, most importantly, operational cooperation (besides, today journalists tend to design the newspaper mainly by printing means). Often, drawn headlines, if they appear on the pages, lose quality compared to clichéd headings. Is it because it happens that random people are engaged in drawing "to the number"? You should not neglect hand-drawn titles (they are especially appropriate in literary and artistic materials; in this case, the titles may be accompanied by drawings), but it is still better to refuse them if the editorial office does not have the opportunity to contact a professional artist.
One type of heading is a heading. Since the rubrics differ in theme, genre, time of action, etc., designers are faced with the task of graphically revealing their unity. Indeed, the groups of headings: "Sketch", "Report", "Feuilleton"; "Remark", "Sharp signal"; "Per round table"," Straight line ", etc. - are not the same in nature and purpose, but each of the listed names is nevertheless a specific type of heading.
When a newspaper has a large selection of hand-drawn headings, this is good - even in the absence of photographs and other illustrations, newspaper pages look quite vivid, but, on the other hand, the neighborhood on one page of a large number of different "clichés" (we take this word in quotation marks, since the concept " cliché "is preserved only with a" metal "typesetting) threatens with excessive variegation, and therefore requires caution, special taste when staging illustrations. Yes, not all of our local newspapers can boast of modern and aesthetic, in terms of applied graphics, hand-drawn headings. Rather, on the contrary - such headings carry a touch of unreasonable embellishment, decorativeism, which is not functionally justified. Headings should be made in the same style, preferably in small sizes, and it is good when their font is in harmony with the font of the title of the newspaper. And since they accompany the permanent sections, readers have a memorable image of their publication.
But the text of headings often includes three words or more, and it becomes impossible to squeeze a rather voluminous text into the small space of the planned "cliché" without compromising the quality of the font. Perhaps that is why the responsible secretaries refuse the services of artists, preferring to use typesetting when submitting headings, sometimes supplementing it with small witty symbols. When it becomes possible to increase the size of the "cliché" (a large thematic collection or page is published), the designers, of course. order permanent hand-drawn screensavers.
It is considered modern to combine graphic and font elements, to use photography or photomontage in headings, screensavers, posters.
Some designers are fond of “inversions” in drawn headings and headings, but the reverse contrast makes it difficult to read, dark “dies” look mournful and lurid. Still, black marks on a white background are perceived better, more familiar. Drawn headings and splash screens should not be either overly laconic or overly complex in content and set of graphic elements. Signs of medium complexity are perceived most optimally.
The fact that the secretaries quite carefully vary the formats of typing, contributes to the creation of rhythm on the newspaper page, complies with the principles of compositional-graphic modeling, and accelerates the prototyping processes. And yet it is absolutely necessary to use additional formats in some specific, pre-agreed cases: when typing especially important editorial materials that go under constant headings and are located in a certain place, captions for images, sidebars, conclusions, etc. Without all this, the newspaper space looks like a solid gray mass, the eyes of readers get tired, moreover, they find it difficult to distinguish the main and the secondary when reading published materials - the design of the newspaper does not fully fulfill its commentary role.
Today, more and more newspapers are trying to avoid "type confusion" on the pages. But there are still large volumes of material in boldface type. At the same time, the reader quickly gets tired, moreover, the graphic rhythm of the strip on which such material is placed is often disrupted. The "dark" font is mainly used for typing "frames", captions for pictures, for highlighting in the text - by the way, all this, as well as the use of primary and secondary fonts in general, should be planned in advance by secretaries. Speaking about selections in the text, it should be noted that the most effective are "active" - synthetic - selections that combine font and non-font means (increasing or decreasing the size, changing the typeface, font style to bold, writing - to italic, discharge, kerning, tracking, set in capital letters, small caps, indentation, increased leading, setting a side ruler, framing, using background substrates, inversion, highlighting). This method is especially often used: "Tie-ins", typed in a non-standard format with an additional bold typeface, they are taken in a light, most often newspaper, ruler, or all the lines of this "frame" are underlined with rulers. At the same time, the designers strive to bring the highlighted part of the material closer to the title.
In many newspapers author's signature type in the same font as the main text. Well, since in other newspapers the number of primary and secondary fonts reaches three or four, it is obvious that it is difficult to maintain order and system in the design of author's signatures. It is necessary to unify the submission of signatures and, regardless of what font a particular text has, all author's signatures should be typed in one size and one typeface. Apparently, unification should also apply photo captions, especially the names of the authors, who in some newspapers are typed in lowercase petit, and sometimes nonparellas, and for some reason the word “photo” is given in light type, and the author's surname is in bold. In some cases, it is good to place the author's signature at the beginning of materials - for example, literary-artistic, artistic-journalistic genres, thus emphasizing the importance of publication.
Another design detail - initial ("flashlight"). As a rule, it is used in the design of large-volume materials, which are divided by internal subheadings, and the initials open each of the parts of the text indicated by these subheadings. When setting the main "heading inside the material, the text must be started with a" flashlight ", to give the reader an extra signal from where to start reading. You can also use drawn" flashlights "- when designing essays, stories, etc., just do not need them get carried away too much, since an excessive number of drawn initials will create variegation on the strip and thereby complicate the perception process.
With the introduction of computer technology, designers began to actively use "Offsets in the text"- several sentences expressing main idea publications. Their design is also modeled, drawing, style and writing of the font are determined.
Newspaper ornament, in contrast to ornament - a type of decorative art, in itself has no ideological and artistic value, but can actively serve to identify it. It should be noted, however, that he can also have some emotional content ("strict", "light", "cheerful"). At the same time, the connection between newspaper graphics and composition is especially closely traced, which, as you know, can also have a different character - dynamic, static ... In general, the entire newspaper ornament should be an ensemble that creates the aesthetic image of the publication, fosters the reader's taste. It should be based on the skillful use of not only three newspaper contrasts (black and white, large and small, wide and narrow), but also the laws of proportion and rhythm, performing the main function - to help identify the meaning of the content of the newspaper.
The principles that gave rise to the desire “to overcome decorativeness, to view the newspaper as a harmonious composition of typographic elements - is expedient from both an aesthetic and production-technical point of view. The elimination of decorativeness shows that designers consider the beauty of a newspaper page not as a collection of elements that should be imported from outside, but as something that follows from the very nature of the page, from the printing materials that make it up ”1. Newspaper graphics are a kind of information. This means that here, too, it is necessary to take into account the factors that lead to resistance of the audience in the course of a persuasive influence: it is impossible to oversaturate a newspaper sheet with graphic elements, and the elements themselves - with details; should not be allowed when using graphics logical errors; it is necessary to take into account the peculiarities of the reader.
The resolution of a kind of conflict "constancy and novelty" confronts the designer when designing each strip, each issue. The designer needs to strive for individualization of any newspaper issue, finding something new in the design details - for example, in the presentation of the elements of the headline complex; in the design of the material due to its internal structure ("inset", subtitle, photo screensaver, initials, paragraphs highlighted in one way or another, etc.). The help of the authors plays an important role here. Journalists themselves can much more accurately use non-linguistic means of revealing the meaning of the material even during its writing: accompany the material with an accurate, emotional heading and subheadings, corresponding heading; break the material into separate semantic pieces, which would be good to separate with "flashlights"; indicate where it is necessary to emphasize certain parts of the text. And these are just some of the many techniques for starting a manuscript. Of course, they should be used only according to the "internal requirement" of the material itself. The designer will complete the publishing processing of the manuscript, including it in the system of spatial, font, color and other allocations of his newspaper.
The designer of the newspaper is at the same time its first reader, who repeatedly checks on himself the conceived and executed. Therefore, the design policy must be clearly understood, first of all, by the responsible secretary himself (only in this case it will be a policy), and unswerving adherence to it will certainly give rise to an understanding of the "newspaper line" and among readers.
The art of newspaper design presupposes: understanding the idea of the page (number); selection of certain materials to express this idea; selection of certain compositional and graphic means for its emotional embodiment. When layouting the pages and guiding their layout, it is important to take into account the whole complex of permanent elements of the newspaper: the title, pages of the issue, text materials and headings to them, illustrations, and service details. The newspaper issue is the final product of the creativity of journalists, graphic designers and printers. Let's see how, using the basic design elements and the laws of composition, press designers create a newspaper issue.
Heading part in newspapers, as a rule, it unfolds to the width of the entire front page or occupies part of the columns.
It includes the logo (the name of the publication, expressed in graphic form), the main imprint. The logo is a kind of trademark, trademark of the publication (it is no coincidence that most of the well-known newspapers - “ TVNZ". "Moskovsky Komsomolets", "Pravda", "Izvestia" and others - not only did not change their names, but also retained the drawing of their font, orders, signs). The font of a newspaper title can influence the choice of primary and secondary heading fonts; the logo is often repeated in a reduced form in the headers and footers of the inner and last pages.
An indication of the year of publication, calendar information, serial number, price of a separate issue are typed either in one line at the bottom of the title, or placed in a separate block - "calendar". There are also combinations of scattering of this data. In general, when typesetting a title, designers use all known methods of presenting it - it's another matter how it looks on the page, whether it is printed correctly ...
It is bad when the heading part takes up too little space, it is not striking, when the font of the title does not meet modern aesthetic standards, when the appeal, imprint and other data are not combined into a complex - they "crumble", are typed in fonts that do not harmonize with each other, when the rulers do not fit in the corners, they are poorly printed, their number is often too large, and therefore they do not fit together ... The area given for the heading part increases, but not by itself, but due to neighboring elements that designers deliberately bring closer to the title. For example, "Obshchaya Gazeta" gives two columns to the right of the title (to its height) to the extended announcement of the "nail" publication of the issue, and under the title, on the entire width of the first page, places announcements of several materials of the inner pages. Considering that the front page is crowned with a catchy multi-line “header” and a “shock” photograph located directly under the heading part, then we can conclude that designers, artificially pushing the boundaries of the heading part, strengthen the reader's orientation apparatus.
More recently, the headlines of local newspapers were actively moving, that is, at the discretion of the designers, they moved both horizontally and vertically. Currently, not only the graphics are stabilized, but also the composition of the title, its location. Today, as a rule, it occupies the upper left corner of the first page; of the other presentation options, two are most often encountered: the title is shifted to the right, and some important material is on the opening; the title goes down a little, and above it is the “header”.
Now they refuse from such a design technique, which was previously recognized as effective, as the use of several sizes of the title. Perhaps this is correct: the title is a constant element of the newspaper, and it is hardly worth giving it a different look. It is best to choose the optimal, not too large and not too small, size of the heading part, and for the title use clear, chopped fonts (they are better read), achieving the same stylistic unity of the fonts of the newspaper title and hand-drawn headings.
Designers actively use in layout and such constant elements as rulers. Lines generally have a special emotional impact on a person: “the horizontal one evokes a feeling of peace, being associated with the horizon line; vertical - conveys the desire upward; inclined - causes an unstable position; broken line - associated with an imbalance of mood, character, some aggressiveness; a wavy line is a flowing line of movement, but with different speeds (depending on the direction: vertical, oblique or horizontal). In addition to movement, it has a rolling sign; the spiral line shows the rotational movement in development ”1. Lines can be "sluggish", "tense", "dynamic", etc., which should be taken into account by designers when choosing separating means and means of accentuation.
Here it is necessary to adhere to the following rules: separating means must make up an ensemble, correspond to the general graphic style chosen by this or that newspaper: their number should not be too large, otherwise variegation is created, it becomes difficult to understand the functional purpose of a particular design tool (ultimately , the consistency of the design as a whole is violated).
Some newspapers choose light (newspaper) and dull 2-point rulers as the main ones. Modern tendencies designs are associated with bolder decisions, with the use of frames to highlight individual materials, more "active" in style and size of the rulers, allowing a more convex outline of compositional layout schemes. In other publications, on the contrary, they abuse framing, are fond of using rulers of various patterns - here in almost every issue you can find straight and wavy, welted and quoted, dotted and ornamental rulers. Perhaps this is a manifestation of some design style of newspapers, but nevertheless, separating means must be used systematically. The number of lines, and especially their quality, harmonious combination with each other and with other elements of the newspaper actively influence its appearance.
Similar information.
This article was written by a representative of the DevExpress company and published in a blog on HabraHabr.
Medical researchers have found that if there is only text in the instructions for a medicine, a person assimilates only 70% of the information from it. If you add pictures to the instruction, the person will already learn 95%.
It is obvious that a person is predisposed to process just visual information. Besides being excellently processed by our brains, data visualization has several advantages:
- Focusing on different aspects of data

With the help of graphs, you can easily draw the reader's attention to the red indicators.
- Analyzing a large dataset with a complex structure
- Reducing the information overload of a person and keeping his attention
- Unambiguousness and clarity of output data
- Highlighting the relationships and relationships contained in the information

It is easy to see important data on the graph.
Aesthetic appeal

Aesthetically pleasing graphics make the presentation of data effective and memorable.
Edward Tufty, author of some of best books on visualization, describes it as a tool for displaying data; encouraging the viewer to think about the essence, not the methodology; avoid distorting what the data is supposed to say; displaying many numbers in a small space; showing a large dataset in a coherent and coherent whole; prompting the viewer to compare pieces of data; serving sufficiently clear goals: description, research, ordering or decoration ().
How to use data visualization correctly?
The success of visualization directly depends on the correctness of its application, namely, on the choice of the type of chart, its correct use and design.

60% of visualization success depends on the choice of the type of graph, 30% on its correct use and 10% on its correct design.
Correct graph type
The graph allows you to express the idea that the data carries in the most complete and accurate way, so it is very important to choose the appropriate type of chart. The choice can be made according to the algorithm:

Visualization goals- this is the implementation of the main idea of information, this is what you need to show the selected data, what effect you need to achieve - identifying relationships in information, showing the distribution of data, composition or comparison of data.

The first row shows graphs with the goals of showing relationships on the data and the distribution of the data, while the second row shows the goals of showing composition and comparing data.
Data relationships- this is how they depend on each other, the connection between them. Using relationships, you can identify the presence or absence of dependencies between variables. If the main idea of the information contains the phrases "refers to", "decreases / increases with", then one should strive to show precisely the relationship in the data.
The distribution of data is how it is located in relation to something, how many objects fall into certain sequential areas of numerical values. The main idea in this case will contain phrases "in the range from x to y", "concentration", "frequency", "distribution".
Data composition- combining data for the purpose of analysis the overall picture in general, comparisons of components that make up a percentage of a whole. Key phrases for the composition are "accounted for x%", "share", "percent of the whole".
Comparison of data - combining data in order to compare some indicators, revealing how objects relate to each other. It is also a comparison of components that change over time. Key phrases for an idea when comparing are "more / less than", "equal", "changes", "up / down".
After determining the purpose of the visualization, you need to determine the data type. They can be very heterogeneous in their type and structure, but in the simplest case they distinguish continuous numerical and temporal data, discrete data, geographic and logical data. Continuous numerical data contains information about the dependence of one numerical value on another, for example, graphs of functions such as y = 2x. Continuous time frames contain data about events occurring over a certain period of time, like a graph of the temperature measured every day. Discrete data can contain dependencies of categorical values, for example, a graph of the number of sales of goods in different stores. Geographic data contains various information related to location, geology and other geographic indicators, vivid example is an ordinary geographic map. Boolean data shows the logical arrangement of components in relation to each other, such as a family tree.

Graphs of continuous numeric and temporal data, discrete data, geographic and logical data.
Depending on the purpose and data, you can choose the most suitable schedule. It is best to avoid variety for the sake of variety and choose the simpler the better. Only for specific data, use specific types of charts, in other cases, the most common charts are well suited:
- linear (line)
- with areas
- columns and histograms (bar)
- pie chart (pie, donut)
- polar graph (radar)
- scatter, bubble
- maps
- trees (tree, mental map, tree map)
- time diagrams (time line, gantt, waterfall).
Line charts, area charts, and histograms can contain several values in one argument for one category, which can be either absolute (then the prefix stacked is added to these types of charts) or relative (full stacked).

Graph with stacked values and with full stacked
When choosing a suitable schedule, you can be guided by the following table compiled from this diagram and:

Correct use of the graph
It is important not only to choose the right type of chart, but also to use it correctly:
- No need to load the schedule big amount information. The optimal number of different types of data, categories is no more than 4-5, otherwise it is more expedient to divide such a diagram into several pieces.

This chart can be compared to spaghetti and is best divided into several charts.
Select the correct scale and scale for the graph. For histograms and plots with areas, it is preferable to start the value scale at zero. Try not to use inverted scales - this very often misleads the viewer about the data.

An incorrect scale negatively affects the perception of the data. In the first case, the scale is incorrectly selected, in the second the scale is inverted.
- For pie charts and graphs that show a percentage of the total, the sum of the values should always be 100%.
- For a better perception of the data, it is better to arrange the information on the axis - either by values, or alphabetically, or by logical meaning.
Correct design of the schedule
Nothing is more pleasing to the eye than well-formed graphs, and nothing spoils the diagrams more than the presence of graphical junk. Basic design principles:
- use palettes of similar, not bright colors, and try to limit yourself to a set of six pieces
- auxiliary and secondary lines should be simple and not conspicuous

Help lines on the graph should not distract from the main idea of the data.
- where possible, use only horizontal axis labels;
- for plots with areas, it is preferable to use a color with transparency;
- use a different color for each category on the chart.
conclusions
Visualization- a powerful tool for conveying thoughts and ideas to the end user, an assistant for the perception and analysis of data. But like all tools, it needs to be applied at the right time and place. Otherwise, information can be perceived slowly, or even incorrectly.

The graphs show the same data, the main visualization errors are shown on the left, and they are corrected on the right.
When used skillfully, data visualization can make content impressive, fun, and memorable.
Visual content
Visual content is all visual information that accompanies the text: photographs, drawings, diagrams, videos, graphic design, logos and more. The active use of visualization tools is not only a tribute to the times (few people will read undiluted text today), it is also a real opportunity to attract and retain consumers.
Basic visualization tools
Visual content posted on a print or web page draws the attention of the reader in the first place. Image captions, headings, and subheadings are then scanned. And if all this could interest the reader, he will pay attention to the main text. Studies prove that our brain perceives visual information 60 times faster than textual information, and the duration of stay on a website page increases 10 times due to pictures and photographs. The advantage of visual content over text is increasingly proving social media where users prioritize photos and videos. This fact is confirmed by the high popularity of Instagram and Pinterest projects.
Means of visual communication and the place of visual content in them.
Consider below what elements of visual communication can be used as visual content:
Photos, including collages.
Drawings.
Videos, animation, including presentations, flash animation and gif-animation (video sequence created by changing photos).
Infographics: tables, graphs, charts, maps and author's illustrations with the inclusion of text comments.
Page design, corporate identity.
Visualization tools include fonts and colors.
Each element of visual content has its own impact on the reader's perception, to the extent that the basic colors used create a mood for certain information and mood (for example, green corresponds to the theme of nature or finance).
Means and functions of visual content
Features of visual content in comparison with text
Easy assimilation of visual information and the requirements of the modern media market make visualization necessary attribute advertising and PR.

1) Photos, videos, infographics are easily and quickly copied, and accordingly are the most efficient in publishing, which gives them advantages over texts, allows them to spread faster in the media.
2) The visual content is reproduced as best as possible by modern electronic devices (smartphones, tablets), it is more convenient for perception on a small screen than text. As an example, 75% of smartphone owners watch videos from these devices.
3) High-quality visual content, especially diagrams, infographics, greatly simplifies and accelerates the understanding of complex and extensive information.
5) Many companies have their own social media accounts, and the most visited profiles are distinguished by rich, but at the same time organic visual content that attracts users with aesthetics, usefulness, and originality. So, Starbucks (photo above), Fanta, Coca Cola, Corner Of Art design studio (Photo below) successfully designed their Facebook pages.

Photo tasks
Photographic images are the most common type of visual content in the media and on the Internet. In addition to the fact that a successful photo attracts the attention of the audience, and, accordingly, gives more chances to read your text, the photo also performs other tasks.
Product photos allow buyers to better represent the company's products.
Photos of real company employees on its website additionally attract users to view the resource: people are interested in knowing the brand by sight.
In business, photographic images are rarely placed without processing: it allows you to pay attention to individual details (image enlargement), hide or, if necessary, highlight flaws.
Experts point out that when choosing a photo for text content, its information content is very important. The more useful information a photo contains for the audience, the more visitors will stay on your page.
The LPgenerator platform publishes the results of comparing the page traffic of two online stores - Pottery Barn and Amazon. The larger retailer Amazon has fewer photo views than Pottery Barn. There are two reasons for this: the TV image gives less information than a photo of a bookcase; The photos in the Amazon store are more generalized, which makes it easier to work with a large mass of them, while the Pottery Barn has a smaller assortment and has the ability to post more detailed pictures.

Features of infographics
The main purpose of infographics is to simplify the presentation of complex material. If developers of visual content use enough imagination and ingenuity, then the data that could make up a complex and boring text will turn into a capacious picture with small verbal comments. With a successful implementation of the idea, your infographics are simply doomed to a lot of views and copies in media resources. In other words, "an image that tells the whole story is easier to copy than a full text article." According to some reports, users get acquainted with information transmitted in the form of infographics 30 times more often than any other. Let's give an illustrative example. In 2012, the American company WordStream compared the effectiveness of Facebook and Google's Display Network as advertising platforms. To draw attention to the results of their research, the company has designed them in the form of infographics (Photo 6). A few days later, this infographic with reference to WordStream was published by several major American media outlets: USA Today, CNN, Fast Company, The Economist and others. And a week after the infographics appeared on the company's website, the Google system found more than 13 thousand articles mentioning WordStream, most of which contained this infographic with a link to the original site.
The secret of video popularity
Video content is the most effective way of conveying information, since the combination of visual and auditory series is perceived faster and easier to assimilate. Not surprisingly, television and videos on the Internet remain at their height. By the way, 71.6% of global network users watch video content at least once a week. Other statistics show that users spend twice as much time on a site with a video. And those who watched a video about a product are 85% more likely to make a purchase from what they saw. And, of course, increasing the length of time users spend on your site increases its position in search engines.
"Information is beautiful" is the translation of the TED talk by David McCandles, who is convinced that visual information and data is the future: