Live chart for binary options in real time. Other useful indicators
Read also
In front of you you see an online tool for identifying trends in the market and carrying out its analysis. On the pages of our resource, you can use it for free an unlimited number of times. Binary options charts in real time are very popular among beginners and experienced traders, as they provide a wide range of tools for performing technical analysis.
Let's analyze a real binary options chart
- On the right, there is a panel of graphical tools, with the help of which you can make convenient notes directly on the chart.
- At the top is the main panel, where you can select the type of asset, timeframe, required indicator and chart type. Usually, when choosing an asset, the indicator is configured automatically and does not require manual changes. But if you are an experienced trader and want to use another indicator, select it from the list.
What opportunities does the binary options chart give online?
1. Carry out a detailed technical analysis taking into account all risks. To do this, use all the main indicators from the list and set the required timeframes from 1 min. Up to 1 month.
2. Create visual elements for graphical analysis. You can save the result in the form of an image for yourself. To do this, simply click on the camera icon at the top right.
3. Choose a comfortable type of schedule. If you are a beginner, then the binary options chart offers the following options:
- Bars, Candles, Hollow Candles are convenient for short-term trading. And the candles are the most descriptive;
- Heiken Ashi mainly for long-term trades;
- Line and Area help to assess the current trend;
- Renko, Line Break, Kagi - these are complex charts and we recommend using them only for professionals;
- Point & Figure helps you identify short and long term trends.
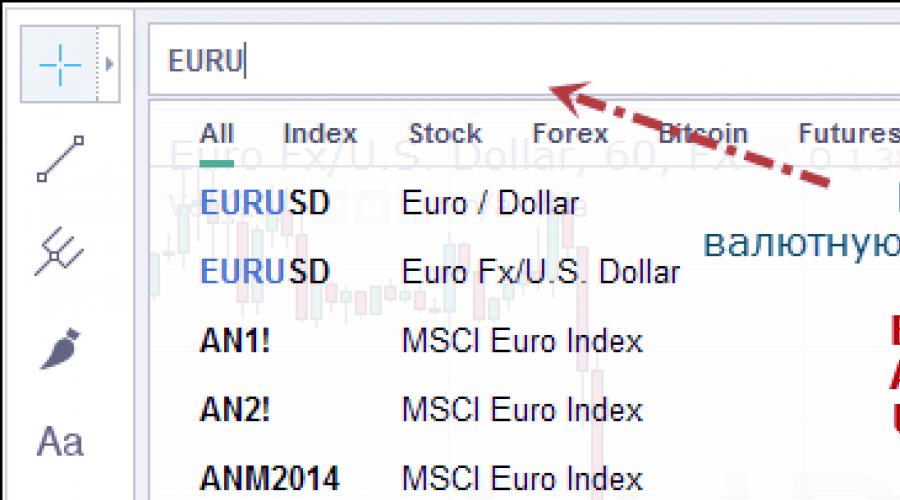
4. Select the required type of asset. To do this, click on the upper left field, where by default EURUSD (EUR / USD) is selected and start typing the name of the desired asset. The list will appear in a couple of seconds. Also a live chart for binary options online allows you to compare assets. In order to analyze the graphs of the price behavior of several assets, click the weights icon and select a pair of assets.
What else you need to know about the live chart for binary options
The live schedule is updated online. You will always see the actual changes in the market and will be able to react to them correctly. Adjust the corresponding parameters of the indicators at your discretion.
It is comfortable to work with the online schedule - nothing needs to be installed additionally. You can use all the tools presented here, they work great and provide a good visualization for the analysis.
When building a live binary options chart, traders work with several major groups of assets. Among them: stocks, indices, currency pairs and commodities. The sections on our website describe in detail all the assets, instructions for working with them. Also check out the factors that affect them. Build a schedule of your choice. The service works without interruptions and delays.
Live chart for binary options, today is the most unique tool that allows traders online, absolutely free, in real time to determine market trends, as well as conduct technical analysis.
This analytical tool is also good because you can work in it online, without any installation of software add-ons. In this post, we want to tell you how to use it online.
Live chart for binary options - the purpose of the algorithm and its main features
The popularity that the live chart for binary options has received is due to the fact that it is much more comfortable to work with it than using similar programs that require their preliminary installation on your PC. To conduct online market analysis, a trader simply needs to open a page with a chart and start using his tools in real time.
So, the live chart for binary options serves as a full-fledged platform that allows you to carry out such operations for free in real time:
apply indicators of technical analysis. Immediately, we note that the number of these indicators is not limited by anything, you can install whatever you need with any parameters. It should also be said that all indicators that have a live chart for binary options are regularly updated in real time.
Thanks to this, traders can instantly see the trends that are occurring and react to them in a timely manner. In addition, each user can, at his discretion, configure any indicator parameter (periods, color, levels, line thickness, selection of the work area, and so on);
recreation of visual elements for the implementation of graphical, market analysis. It is very convenient to use trend lines with a chart to determine the market trend.
work with a wide variety of types of charts. Here you can find line charts, Kagi, American bars, Tic-tac-toe, Renko and much more.
setting the necessary (depending on market situations) time frames. At the same time, the time for building graphs can be manually adjusted in a wide range - from a minute to a year.
Online chart for options, offers quotes for all key underlying assets used in the work of traders, which are divided into 4 subgroups:
- stock,
- goods,
- indices
- and currency pairs.
Studying a live chart with its tools online for binary options analytics
Due to the wide variety of tools provided on the chart, traders can independently create trading strategies and receive useful signals in real time. The scheduling takes place online without any delays or delays.
In other words, thanks to the use of this tool, You can see at once everything that is happening in this second on the market and respond appropriately to what is happening.
How to use live chart tools for binary options online?
So, what is a live chart for binary options, you have already understood. Now let's take a look at how to use it. To begin with, this graph is based on a platform built with HTML5, not Adobe Flash, so it is lag free and as accurate as you can imagine.
In addition, the live chart for binary options gives out prices online much faster than any broker (as you know, they have small delays), which means that if the trader is "smart", he will be able to close the option faster and earn good money.
How to start online analysis using a live chart?
The first step is to select the asset to be traded. Then decide on the type of schedule and. And at the end, pick up the indicator. So, in order ...
It all starts with the choice of an asset, and there can be several dozen or more such assets. You need to choose one.
As a rule, on the live chart, by default, the asset is already selected initially, this is the EUR / USD currency pair. To select another asset, you should erase its name in the window with the asset. After that, a complete list of all assets offered for trading should appear. Choose from the list the one that interests you - commodities, stocks, currencies or indices. If you know the name of the asset, you can simply enter it into the line with the English layout.

Since there is a great variety of traded assets in the chart, including exotic ones, to speed up the search, you can enter the first letter of the name and the chart will offer you a whole list at once.
The second step is to select the required type of chart.... To carry out this process, you must use a special menu, as in the picture below:

The question immediately arises, which type of chart should you choose?
After all, there are bars, Japanese candlesticks and, finally, line charts and so on. Experienced traders strongly recommend using "Candles", that is, candlestick charts, which are usually already set by default.
The reason is simple - exactly this type of graph gives traders the maximum amount of useful information. But for a general idea, explore the possibilities of other graphs.
Types of "live" charts and their characteristics
In short, “ Bars"(Histograms or pillars) is also a fairly descriptive chart used by many traders. The "Hollow Candles" chart is practically the same as regular Japanese candlesticks. Only the growth of quotes in it is indicated not by green candles, but by white ones. Sometimes during trading, this effect adds clarity.
The simplest graph is “ Linear"(Line). This chart makes it possible to very quickly assess the current trends, that is, to determine the direction (upward / downward) of the currency. The Heiken Ashi chart is a rethinking of ordinary candlesticks - it is smoother and best suited for those who like long-term trades (it is better not to use it for short-term ones).
« Dyed linear»Graph (Area) - is one of the variants of the usual line graph, only with a colored bottom for better clarity and display of the trend.
Tic-tac-toe chart is a special chart that allows you to identify long-term and short-term trends. The live chart for binary options also contains other types of charts, which you can learn more about by visiting the web resource on which it is hosted.
The next step is to choose a time period or time frame. This step makes it possible to analyze the real situation, or to study the historical price formation for a particular trading asset of interest to us. By default, minute candles are set on the live chart for binary options, but you are free to choose any time frame from a minute to a month.

Choosing a timeframe is a VERY IMPORTANT moment, just like choosing a chart type, rate size or indicator, as this process allows you to order the price movement over time.
Well, the most interesting final step is choosing an indicator. It is at this stage of working with a live chart that most traders get stuck in a loop, since there are thousands of them here. To select an indicator, you must activate the button in the menu " Indicators».

The task of indicators is to display the current market trends and try to predict its future. At the same time, one does not need to harbor illusions, there is not a single indicator, regardless of its name, that could predict future events by 100%.
The use of indicators embedded in live online charts allows us to identify only the general trend. What we basically need. Only by and large, we should use indicators that will determine this trend as accurately as possible. But there are also a lot of such indicators - "", all kinds of oscillators and other similar tools that help in technical analysis.
What do specialists recommend when trading a live chart for binary options in real time?
And they recommend starting with the Price Oscillator indicator, which is an oscillator of the price level. This oscillator displays the trend with sufficient accuracy and makes it possible to predetermine its further development. In addition, it is not at all difficult to use it. See for yourself:

Here, the main task is to find the peak of the trend, enter the market on it and purchase the "Below" option, or enter at the lowest point and purchase the "Above" option.
Don't forget to experiment with other useful indicators as well. For example, Bollinger Bands, the convergence of the lower and upper lines at an extremely close distance to each other, indicates a possible trend change.
Very useful and very popular with most traders, it is also a great indication of an impending trend change.
This is indicated by its intersecting red and blue lines at the bottom or top of the chart. You can also determine the direction of the upcoming trend using a stochastic oscillator or. Here we will be interested in the lines that are located either under the filled area, or above it.
As you can see, the live chart offers a huge number of possibilities for binary options, the main thing is to use them correctly.
Analytical analysis tools, live chart of binary options
To make the picture more complete, let's say a few words about the charting tools that offer traders to use the live chart for binary options. On the side of the menu, you can see a large number of useful charting tools, the use of which allows traders to receive additional information.

What are all these charting tools used for?
A multitude of different lines provide an opportunity for any required angles. Letters and arrows, as a rule, mark the most useful moments in trading. But, for example, the tools of patterns and positions are a very useful opportunity to select, say, the price ranges with which you intend to work, as well as the subsequent drawing on the projection chart for further trading.
More details and details about charting tools for trading with a live chart online, you will find directly on the site where this useful tool is posted.
We use a live, option chart to the maximum:
Convenient and free trading tool for working with binary options or forex - live quotes chart online. It is a kind of scheme that reflects price movements in the foreign exchange market. With it, you can track market trends, conduct analytics, compare quotes with those provided by the broker. The live chart shows in real time the buy-sell rate of a particular currency pair. You can use it without registering and installing additional programs (such as Metatrader4 or 5) on your computer. By default, the chart displays Moscow time, half-hour candles and the euro-dollar currency pair.
Attention! Live graphics are not intended for mobile devices and are not reflected correctly on them!Benefits of live graphics
In addition to the above, the tool has the following advantages:
- Displaying quotes in real time from several providers (FX, IDC, OANDA);
- The modern platform, written in the HTML5 programming language, ensures accurate graphics work without delays;
- High speed of displaying price changes (delays can be caused by low speed of the Internet connection);
- Simplification of understanding the financial market through graphical display;
- The ability to adjust the plotting;
- The presence of the main indicators for finding successful entry points to the market.
Live chart for binary options with indicators is an indispensable assistant for a trader to conduct technical analysis.
How to use the live chart
To use the live Forex chart correctly, you need to adhere to a certain sequence of work:
| 1. Selecting an asset for which you plan to trade. | The EURUSD pair is considered a classic. A potential trader can choose any other instrument by entering its name in English in the box. But by default, the live chart displays EURUSD online. Simultaneously with the selection of an asset, you must also select a quote provider (in the drop-down list on the right). Currently (2017) the most accurate quotes are provided by OANDA. |
| 2. Choice of time period. | When choosing a time interval, the graph will divide the information into specified time intervals. For example, an interval of 1 minute is selected. On the chart, each new candlestick or bar will represent minute segments. Binary options traders like to use short time frames, Forex traders prefer long time frames - day, week, month.  |
| 3. Selecting the type of schedule. | There are 10 chart types to choose from, but candlestick charts (Heikin-Ashi, Japanese or hollow) are considered the most illustrative. Bars are the oldest display of price movement in the market, but difficult for beginners to understand. Line and Area - twin sisters, are used more for determining the direction of the trend and finding tops and bottoms. Renko and Kagi charts, Tic-Tac-Toe, Line Break are rarely used by beginners and are more like a game application to live charts.  |
| 4. Choice of indicator. | Unfortunately, you can't tell everything about indicators on a live chart. But out of the many presented indicators for technical analysis, beginners are better off using the Donchan Channel, Bollinger Bands, moving averages or a stochastic oscillator.  |
| 5. The choice of drawing tools. | With the help of them, figures and trend lines are drawn, support and resistance levels are determined: Crosshair - allows you to fix the cursor at the selected point. |

- On one computer, open the chart itself and the broker window at the same time; for this, the monitor is divided into two parts,
- Connect a smartphone for work,
- If the graph does not open on your computer, the browser may be out of date.
If the live chart of the Euro / Dollar or any other pair is not moving, check if today is a day off?
Attention: on Sat and Sun, exchanges around the world are closed!
To trade binary options, you can use the MT4 platform, but there is an equally convenient option - a live chart for binary options online. It can be opened directly in the browser, quotes are updated instantly. Some brokers have delays in displaying prices due to signal providers, albeit subtle, the live chart for binary options does not allow this.
How to use the live chart. Quick Start Guide.
1. Trading assets
Traders can rest assured that the list of available assets available on live options charts in real time is quite impressive. Many brokers can trade not only standard currency pairs like USD / JPY, but also different “exotics”. The developers of live chart for binary options online strive to satisfy the needs of all traders, so you can easily find even less popular pairs like USDZAR or USDSGD in it. In order to find the desired asset, in the upper window, delete the EURUSD inscription and enter the name we need. Hints work, offering various options, for this it is enough to start entering the first letters.
2. Chart type
Live options charts allow you to select the type of chart, the function is located on the panel next to the name of the asset. A total of 10 types are offered:
- Candles (Japanese candlesticks) - the most popular type of displaying quotes;
- Bars (bars or bars) - less common than candles, but some traders prefer it due to the informativeness and brevity of the price display;
- Hollow Candles - their only difference from the usual ones is that the “bullish” candle is painted white for greater clarity;
- Heiken Ashi - the chart is similar to ordinary Japanese candlesticks, but the calculations for their construction are completely different - some information is taken from the previous candlestick. In general, the chart type is suitable for long-term trading;
- Line - perfectly shows the main trend, but it is inconvenient to work with it when making deals;
- Area (colored linear) - modification of Line with a colored lower part, for visual demonstration of the trend;
- Renko (renko) - suitable for professionals with good training. The chart displays the main trend in the market, it is used to determine the support and resistance levels, the beginning of the reversal;
- Kagi (kagi), Point & Figure (tic-tac-toe), Line Break (linear break) - non-standard charts, intended for experienced traders who are well versed in the relevant strategies.
3. Timeframe
By choosing a specific time frame of the live chart for binary options, we determine the interval during which one candlestick will be formed. The list of time frames is optimal for binary options: for example, timeframes that are missing in TM4 appear at 3 minutes, 45 minutes, etc.
4. Set of indicators
The live chart for binary options has a large number of indicators that will be useful to a trader for trading. The main thing to remember is that none of them is an "oracle" that predicts the future price with one hundred percent accuracy. The indicators show the main trends, which are likely to continue in the future. The trend is shown well, for example, the Bollinger bands and various oscillators.
It is advisable to study the principle of the Price Oscillator, which determines overbought and oversold levels, signaling a suitable entry point to the market. The trader's task is to buy a Put option when the bullish trend begins to lose power, and vice versa.
To conveniently position the windows with the broker's trading terminal and the live tradingview chart, use the Win + Right (or Left) arrow key combination (for Windows 7, 8). The live chart window for online binary options will take up half of the screen, you can easily move the trading floor to the vacant space. You will not need to be nervous, constantly being distracted by collapsing / expanding browser tabs.
The live chart for binary options is very convenient, in terms of functionality it can only be compared with specialized platforms ThinkOrSwim or MetaTrader, on which additional modules are installed. The tradingview live chart is the best choice for successful trading.
The first is the live schedule itself, detailed instructions on how to use it are at the bottom of the page, under the video. The dots on the chart are the ideas of all traders using the full version of the chart. So you can “consult” with colleagues in absentia. Green dots are folk ideas for price increases. Red - to decline. Yellow - special ideas, without a pronounced movement. If the dots get in your way, just click on the light bulb icon.
Below is a table of economic news. News with 3 "heads" always affects the market, be very careful with them. The table shows the actual data (Fact.), previous (Prev.) and Forecast.
If the forecast differs greatly from the actual data at the news release, the market often explodes with a strong reaction. You can trade it too, but it is wiser to skip it and enter a little later, when the passions subside. You can read more about this in the Schools website.
To the left of the news is a table of technical signals. It is a mechanical system based on 20 indicators that indicates the direction of the market. Accordingly, the instructions Buy actively and Sell actively indicate trends - upward (hence the recommendation to buy) and downtrend. The table allows you not to litter the chart with similar indicators, because it will show the direction of the market anyway.
The last table ( Community Outlook) allows you to study what the retail market is currently inclined towards (data aggregated from 60 brokers). For example, if at 85-90% of the market bets on an increase in EURUSD, it is quite possible to expect it to go down soon, because this is the basis of market dynamics - if all buyers, then there is no one to sell and vice versa. It also allows you to enter against the crowd and use a variety of related strategies. By hovering the mouse over the desired asset, you will see the general market sentiment as a percentage, or you can evaluate it directly by the color indicator. Short(short) are trades to reduce the price, Long(long) - for her height. Columns Avg. Short (Long) Price- where, in the opinion of the crowd, the price will go from its current value (indicated in the column Current Price).
Like the markets themselves, live charts and tables work Monday through Friday.
Live Chart Basics
Advanced version of live graphics
Live schedule: rules of use
To work with binary options, we need such a wonderful chart. We'll talk about how to use it below.
What is it good for? Live (online) means that quotes are displayed in real time. The platform on which the graph is made is HTML5, no Adobe Flash for you, so the graph is as accurate and lag-free as possible.
Terms of use of the chart
What we see interesting in the chart. We need:
- Choose an asset for which we will trade.
- Select the type of graph.
- Select a time period.
- Select an indicator (the most interesting).
Let's go through each item in turn.
1. Choosing an asset for trading
This is where it all starts. Let's say we have several dozen major assets and we need to choose one of them. Usually everyone tries with the classic EUR / USD.
To select it, click in the leftmost window, erase the unnecessary inscription there and enter EURUSD or the pair that we need.
How to choose an asset to work with a chart.
By the way, there are hundreds of assets, so if you need something exotic, just enter one letter of it and you will get a whole list at once.
2. Select the desired type of chart
The schedule, in fact, is not one - there are about 10 popular ones. To select the option you need, use this menu.

Choosing a chart type for binary options.
Which one to choose? The most super duper popular chart is definitely Candles. It is the most visual and therefore everyone simply adores it. Most likely, it will be selected by default.
However, be sure to look at the other charts to get at least a general idea.
- Bars (pillars or bar graph) - a fairly visual chart, but inferior in usefulness to candles. However, some traders love it.
- Candles ... Our all - favorite and most popular option.
- Hollow Candles - the same option as the previous one, but the quotes growth candles are colored not green, but white. This sometimes adds clarity to trading.
- Heiken Ashi ... Rethinking candles. The chart is smoother and better suited for long-term rather than short-term trades.
- Line (linear) ... The simplest schedule of all. It allows you to quickly assess the current trend - whether the currency is going up or down. But for real trading it is better to switch back to candles.
- Area (colored linear) ... The previous version, but the lower part of the chart is colored for clarity, which even better reflects the trend.
- Renko (renko) ... For advanced professionals only. A chart from Japanese traders that does not take into account time or volume.
- Line Break ... Like Renko, the graph is for advanced pinocchio.
- Kagi (kagi) ... Another Japanese indicator, created already in 1870. Advanced level.
- Point & Figure (tic tac toe) ... A special chart that allows you to identify medium and long-term trends.
We will dwell on each version of the schedule in more detail in separate articles. In the meantime, just choose Candles - it is on candles that traders make their first money.
3. Choose a time period (timeframe)
This point is no less important than the chart, indicator and bet size. A timeframe is a way to organize price movement over time. For example, if 5 minutes is selected, each candlestick on the chart will be drawn for exactly 5 minutes.

Choosing a timeframe for trading.
4. Choosing the right indicator
This is where what many love begins. Most traders get hung up on choosing the right indicator. To do this, click on the button Indicators.

Button for selecting indicators.
There are thousands of these indicators, and you can choose the most popular of them on the chart. The task of the graph is to display current trends and try to predict future ones.

There are thousands of indicators for binary options - but you only need a few of them.
However, do not try to invent a time machine - no indicator, no matter how it is called, can predict the future 100%. Yes, this is not his task. The indicator allows you to identify the general trend, and the trend is such a thing, the development of which is not so difficult to predict.
In fact, you want an indicator that shows a simple picture of the market. As a rule, these are various oscillators, Bollinger bands and other technical analysis tools.
For example, one can start with an indicator such as Price Oscillator- price level oscillator. Simple and intuitive tool.

Price Oscillator indicator (price movement oscillator).

How to use the oscillator to buy binary options.
As you can see, the task is to enter at the peak of the trend and buy a down option, or enter the bottom point and buy up. The art of predicting trends using an indicator is what distinguishes a beginner from an experienced trader.
This will come with experience and after hundreds of deals - so don't try to embrace the immense. Also, consider trading without indicators - Price Action, about which a whole school is presented on the site.
Other useful indicators
except Price Oscillator try indicators like:
- ... Where the upper and lower Bollinger bands converge as close to each other as possible, a trend change is possible.
- ... When the red and blue lines intersect at the top or bottom of the chart, there will be a trend change. A very useful and very popular indicator among traders.
- Moving Average Exponental
... Another super popular indicator. Actually, we need three of them, with the values 6, 14 and 26.
Add the indicator three times, click on the gear icon and enter the desired value.
Here, too, everything works at the intersection of lines. When line 6 crosses line 14, line 26 is below them and everyone is looking up - the trend will go up.
Conversely, if line 26 is above line 14, line 6 is below both of them and everyone is looking down, you can buy a decline. - ... Of primary interest are the lines above and below the shaded area. It is by them that one can judge whether the trend will go up or down.
Graphical tools for live charting
On the side of the chart, you can see a lot of useful charting tools with the help of which experienced traders receive the necessary background information. Let's look at these tools from top to bottom.

We draw shapes on a live chart.
- Cursor crossing(cross, point, arrow or eraser).
- Various lines... Allows you to draw trend lines at all possible angles.
- Trend charts... Lots of charting tools to help you predict trend movement. To draw them, click on the maximum upper or lower candlestick on the left side of the chart, then drag it to the last candlestick on the right - this way you can see the trend movement.
- Forms... Drawing a variety of graphic shapes - rectangles, ellipses, etc.
- Arrows and letters... Arrows and lettering help you to highlight points of interest.
- To remove all of your arts, reload the page or simply select Eraser from the first menu and delete all unnecessary. You can also select the brush and wrench icon and turn it off, which is not required.
- Position and pattern tools... A useful opportunity to choose, say, a price range in which you are interested in working and draw a projection for further work.
Do not get carried away with graphic elements and do not litter the schedule with your creativity. The main thing you need to find is a trend. For this, indicators are not required, but they can be helpers.
All in all, this lively timeline is the most functional and most advanced you can come across. Only a specialized program like MetaTrader or ThinkOrSwim with special modules and settings can be cooler than it. But we will have a separate conversation with them.
Two graphs on one monitor: a useful trick
There is one small trick to using the graph. You need to simultaneously monitor both him and the broker's window in order to place a bet on time.
It is most convenient to divide the monitor screen into 2 parts, say, the broker window on the right, and the chart window on the left. But doing it manually is inconvenient, and it turns out unevenly. For some reason, not everyone knows that in Windows 7 and 10 this is much easier. Namely:
Select the browser window and press the keyboard shortcut Win and left (right) arrow .
As a result, the window will occupy exactly half of the screen! So you need two windows, for one you press " Win and left arrow", for another - " Win and Right Arrow“And then get the perfect trading window.
In addition, brokers offer options with an Android or iOS application - you can click on the "Up" or "Down" button, place a bet and select a time period right on your smartphone, which somewhat adds to the convenience. But this is not a substitute for a full-fledged trading schedule.