Market equilibrium and the state. Models of government intervention in market equilibrium The purpose of such intervention in the established market equilibrium
Read also
The need for state regulation of the market economy is due to both the imperfection of individual markets and the need to solve macroeconomic problems. The main methods of state regulation of the market are: state control over the level of prices, the introduction of taxes, the provision of subsidies, the establishment of market quotas.
Price fixing is carried out by the state in the following cases:
1) the equilibrium prices seem too high to the society (the state sets their level below the equilibrium ones by introducing the maximum level or ceiling of prices);
2) the equilibrium price seems to be too low to support commodity producers (the state legally sets prices above the equilibrium level, the so-called minimum prices or the lower price level).
In the first case, there is a shortage of goods (excess demand), and in the second - a surplus of goods (excess supply). This situation is reflected in Fig. 3.9.
Rice. 3.9. Price fixing
Fixed prices that exceed equilibrium prices are set in some countries for agricultural products, most often as a result of political pressure on the government from agricultural producers. However, in this case, the government must solve the problems associated with the emergence of a surplus of products on the market. Often the government buys all this surplus with taxpayer money. But it cannot "throw" the purchased products to the domestic market, as this will inevitably lead to a decrease in market prices.
Export of products to other countries does not solve the problem either, since in this case the state competes with its own private exporters in the external market, thereby reducing private exports, which leads to an increase in supply and a drop in prices within the country. The government has to increase state stocks of agricultural products without a clear prospect of their further use (store, destroy, provide free aid to other countries, etc.).
In an attempt to reduce the surplus of production, the government may resort to additional administrative measures. For example, it can set quotas for each producer on the volume of production or the limits of cultivated areas, it can pay premiums for their reduction, etc. This will lead to a reduction in supply and a decrease in surplus production. But these measures require the creation of a special administrative apparatus, increase government spending on its maintenance, on the payment of the aforementioned bonuses, etc. In this regard, many foreign economists question the economic feasibility of setting government fixed prices above the equilibrium price level.
When setting a price ceiling below the equilibrium level, the state, as a rule, tries to solve certain social problems. For example, if the equilibrium price is so high that it excludes the given product from the consumption of the majority of the population, and the product belongs to basic necessities (bread, sugar, milk). Most often, a similar situation is likely during periods of wars, crises, crop failure, etc. As a result of the introduction of fixed prices below the equilibrium level, a persistent shortage of goods arises.
This means that by setting a low price for the benefit of the population, the state, at the same time, does not guarantee all its citizens the physical ability to receive this product.
Another negative consequence of setting the administrative price below the equilibrium level is the emergence of a “black market” with very high prices. The black market is a satellite
com deficit, since some citizens are ready to overpay in excess of the price set by the state for goods that are not in official trade. As a result, the low price leads to the limitation of the volume of supply at the level of Q s 2. This fixed volume of output leads to a shift in the supply curve from position S to position Si and the formation of a black market price at the level of P2, significantly higher than the equilibrium level of P E (see Fig. 3.9). As a result, there is a decrease in the level of consumer welfare.
^ Illustrative problem
Supply and demand are described by the equations: Q d = ~ = 8000 - 12P and Q s = 4P- 750. How will the situation on the market develop,
if the administrative price is set equal to CU 500? What will be the price of the "black market" in this case? Solution
With P = 500 DE Q d = 8000 - 12 500 = 2000 pieces, and Q s = = 4 500 - 750 = 1250 pieces. Since Q d> Q s, the market will have a situation of excess demand (shortage of goods) in the amount of 2000 - 1250 = 750 pcs.
With P = 500 CU, manufacturers will supply the market with a volume of products equal to 1250 pcs. Let's substitute this volume in the demand equation: 1250 = 8000 - 12P, 12P = 6750, P = 562.5 CU. This is the “black market” price, which is much higher than the state price.
Counteracting the deficit, the state can either increase the supply of missing goods through additional purchases abroad, or reduce the demand for goods through rationing, i.e. setting restrictions on the volume of purchases (for example, using cards, coupons, coupons to normalize the consumption of scarce goods). Both of these methods were widely used in our country during the existence of directive prices set by the state.
Rationalization is the government's restriction of the volume of purchases for certain goods.
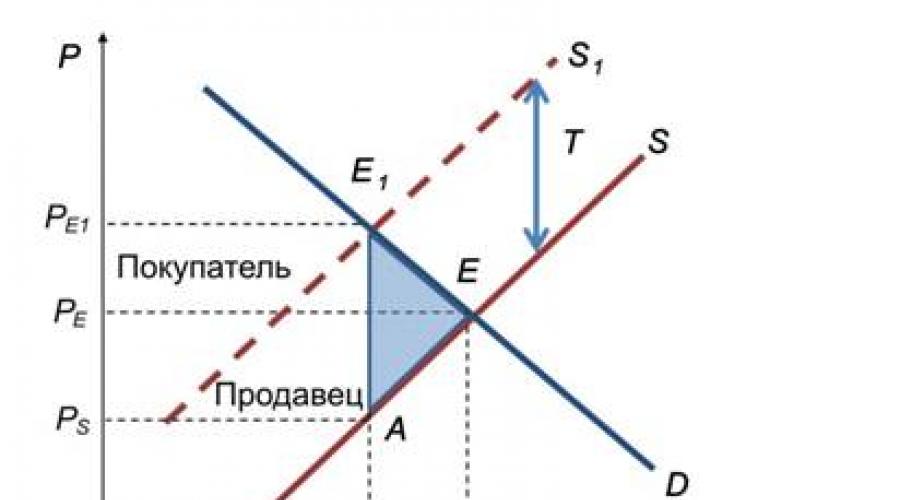
Indirect taxes. The mechanism for the payment of indirect taxes (VAT, excise taxes, customs duties) assumes that the buyer pays the price for the goods with a surcharge in the form of an indirect tax, and the seller transfers an amount equal to the amount of the tax to the state budget. As an example, let's say that the state has introduced an excise tax (T) in the form of a fixed amount of payment for each unit of goods (Figure 3.10).

Rice. 3.10. Changes in the market equilibrium under the influence of an indirect tax
The seller will be forced to ask for any quantity of goods a price higher than the previous one by the amount of the tax. This will lead to a shift of the equilibrium curve to the left upwards and the establishment of a new equilibrium point (E 1), which will correspond to a new, increased equilibrium price (E ei) and a new, reduced equilibrium quantity (Qet) - This means that the buyer will have to pay more than before the tax was introduced. But the seller won't win either. After all, from the selling price of each product, he will have to give the state an amount equal to the amount of the tax. As a result, “price minus
tax ", i.e. what the seller actually gets will be only Ps, which is clearly less than P E.
The amount of government tax revenues will be equal to the tax rate multiplied by the number of goods sold (T · Q 1). On the graph, they will form a rectangle P s P E1 E 1 A. In this case, the tax burden will be distributed: part of the tax will be paid by buyers, part - by sellers.
In fig. 3.10 shows that tax payments are located exactly in that part of the market equilibrium graph, where the surplus of the consumer and the producer was previously located, i.e. the state with the help of taxes withdraws part of them in its favor. At the same time, the shaded triangle АЕЕі, reflecting another part of the reduction in the volume of consumer and producer surpluses, will not be included in the state revenues either, i.e. will simply disappear without reaching anyone. Therefore, it can be defined as the net loss of society associated with taxation.
I- "* Illustrative problem
0 Supply and demand are set by the functions: Q d = 100 - P and Q s = 2P - 50. The state introduces a 10% sales tax. What are the consequences of this?
After the introduction of the tax, the offer function will change, since 10% of the price will have to be paid in the form of tax. Consequently, the enterprise will have 0.9Р, then the supply function will be described by the expression Qs = 2Р · 0.9 - 50.
The demand, which has remained unchanged, is equated to a new expression for the supply: 100 - P = 2P · 0.9 - 50, therefore, P e * = 54 DE, Q e * = 46 pcs.
Before the introduction of the tax: 100 - P = 2P - 50, therefore, P e = 50 DE, Q e = 50 pcs.
Thus, the equilibrium market price increased by 4 units, and the equilibrium volume decreased by 4 units.
The impact of indirect taxes on sales and the distribution of the tax burden depends on the slopes of the supply and demand lines. Consumers pay the tax in full, either with a vertical demand line or with a horizontal
noah supply line. Producers pay full tax on either a vertical supply line or a horizontal demand line. The less elastic the demand and the more elastic the supply, the more tax falls on consumers and the less on producers. Given that the elasticity of supply increases over time, an increasing proportion of the tax is shifted onto the shoulders of consumers.
Thus, the introduction of taxes causes a shift in the supply curve to the left, an increase in the market price and a decrease in the volume of sales of goods.
Subsidies and grants. A kind of antipode of taxes is government subsidies and subsidies.
Subsidy is a one-time allowance in cash or in kind provided from the budget or from special funds to individuals or legal entities, local authorities, and other states.
Subsidy - government cash benefits in the form of additional payments provided to citizens and individual organizations to cover losses or for special purposes.
In order to stimulate the production of some goods, the state can take on part of the producer's costs (to support a loss-making enterprise or an expensive high-tech project). Subsidies or subsidies (H) cause a shift in the supply curve (Figure 3.11) from position S to position S 1. As a result, a new equilibrium point (E 1) and the corresponding equilibrium price (Pe 1) and equilibrium volume (Q e 1) appear.
For each product sold, the manufacturer will receive an additional payment (H), i.e. the actual selling price of the product, taking into account the subsidy for it, will be
![]()
The total amount of government spending on subsidies is equal to the value of the product subsidy multiplied by the number of goods sold, which on the graph corresponds to the area of the rectangle

Rice. 3.11. Changes in the market equilibrium under the influence of subsidies
Compared with the previous equilibrium price P E,

to the producer or the consumer, in fact, this is a net loss of society from the provision of a subsidy. As in the case of taxes, one has to pay for the artificial deviation of the equilibrium point from the natural level - part of the subsidy amount is lost.
Illustrative task
Supply and demand are set by the functions: Q d = 1200 - 5P
and Q s = 500 + 5P. The state provides a subsidy to the manufacturer in the amount of CU 10 per unit of production. How will the equilibrium price and equilibrium volume change after the introduction of the subsidy? What will the manufacturer's selling price be equal to?
After the introduction of a subsidy of 10 CU per unit of production, the supply function will change: Q s = 500 + 5 (P + 10). The demand, which has remained unchanged, is equated to the new expression for the supply: 1200 - 5P = 500 + 5 (P + 10). Therefore, P E = 65 DE, Q e = 1200 - 5 · 65 = 875 pcs.
Before the introduction of the subsidy, the market was characterized by the following parameters: 1200 - 5P = 500 + 5P, therefore, P E = 70 De, Q e = 850 pcs.
Thus, the equilibrium market price decreased by 5 CU, and the equilibrium volume increased by 25 units.
The producer price will be: P s = P 0 + H = 65 + 10 = = 75 De, which is higher than the initial equilibrium level
by 5 MU (Pq = 70 MU).
Thus, the introduction by the government of subsidies and subsidies to producers causes a shift in the supply curve to the right, an increase in equilibrium production volumes, and a decrease in equilibrium prices. Subsidizing consumers, respectively, causes an increase in consumer income, a shift in the demand curve to the right, an increase in the market price, and an increase in the equilibrium volume of sales. In any case, subsidies and subsidies entail an increase in the surplus of consumers and producers, an increase in their well-being.
The state has been influencing market equilibrium since ancient times. Direct and indirect impacts of the state on the market mechanism are distinguished. An example of the indirect influence of the state on the market mechanism is tax policy. A tougher instrument of public policy is direct influence of the state on the market mechanism by setting maximum and minimum prices.
Maximum price(“Socially low price”) is set by the state in order to protect low-income consumers for socially significant goods (food, medicines). Maximum price(P max, Fig. 13) - the upper border of the price, the “ceiling” of the price.
The maximum price is always less than the equilibrium one. The natural consequence of setting the maximum price is the emergence of a deficit (Q dmax> Q smax) and its transformation into a chronic one, since the market mechanism for overcoming the deficit by increasing the price of the missing product and increasing the volume of its supply is blocked, and the supply curve is thereby artificially “cut off” to the segment S 1 S 2. The actual sales volume of this product will be reduced to Q smax (Q smax< Q Е). Общество столкнется с необходимостью нормирования распределения этого товара неценовыми методами (карточная система, очереди, списки). Затраты покупателей на приобретение товара будут выражаться не только в деньгах, но и в виде потери времени и нервной энергии.
The high price creates a “black” (illegal) market. Selling goods on the black market carries additional risks and increases in costs. The supply curve shifts to the left. Segment S 2 S 3 shows the supply in the black market conditions. The graph shows that the supply is decreasing, and the price of the “black” market - the shadow price (P 1) is higher not only the maximum (P max), but also the equilibrium price (P E). The difference between the equilibrium price (P E) and the shadow price (P 1) represents the risk price. As for the total volume of sales in the case of setting the maximum price, even taking into account the amount sold at black market, it will be less than the equilibrium volume (Q s1< Q Е). Следовательно, даже дополненное “теневой” экономикой государственное вмешательство в рыночный механизм не решает поставленной цели и разрушает рыночный механизм.
Minimum price - Another option for price regulation is established by the state in order to support certain industries (for example, agriculture or new high-tech domestic industries) and is often supplemented by restrictions in foreign trade. Minimum price(P min, Fig. 14) - the lower border of the price, its “floor”.
The minimum price is always higher than the equilibrium one. Setting the minimum price leads to an excess, overstocking (Q smin> Q dmin), which becomes chronic for the same reasons as the deficit in the case of setting a maximum price. If the minimum price is set, the supply curve takes the form of a broken line with a horizontal segment at the “floor” level, the price P min (Fig. 14). A surplus of goods forces the government to resort to various ways to stimulate demand or reduce supply. Here, as well as in setting the maximum price, the state replaces the market mechanism. It should be noted that the minimum price pushes producers to illegally sell surplus at a lower price, up to the equilibrium price (P E), which means the emergence of a shadow economy.
So, the state establishment of the upper or lower price limit undermines the market mechanism, upsets the market equilibrium, leads to a reduction in the volume of products sold in comparison with the equilibrium volume, and gives rise to the shadow economy.
Conclusions:
The market economy is an economic system based on private property, on factors of production, social division of labor, on decisions made by individual business entities.
The main features of a market economy:
various forms of private property;
economic freedom;
economic responsibility;
universality of the market;
competition;
free pricing;
Market is a system of economic exchange relations between a producer and a consumer.
Market functions:
informational;
regulatory;
sanitizing;
pricing;
control.
The advantages of a market economy:
freedom of choice and actions of business entities;
high adaptability and flexibility to the changing conditions of the economy;
the ability to quickly meet the needs of people;
stimulating the efficient use of limited resources, etc.
Disadvantages (fiasco) of the market:
inability to solve strategic fundamental problems;
does not provide a solution to social problems;
does not stimulate the development of social sectors of the economy.
The main market mechanisms are demand, supply, price.
Demand is a realized solvent need. Price and non-price factors influence demand. The law of demand: under these conditions, with an increase in price, the volume of demand decreases and vice versa. The dependence is reversed.
Offer - goods and services that are on the market or can be delivered there. Price and non-price factors influence the offer. The supply law establishes a direct relationship between the price and the amount of the offer.
Market equilibrium is a state of the market in which demand matches supply. Equilibrium parameters:
Q d = Q s = Q E
P d = P s = P E
Elasticity is the degree to which demand changes under the influence of factors influencing it. Distinguish:
price elasticity of demand;
income elasticity of demand;
cross elasticity.
The elasticity of the proposal is the degree of change in the proposal in response to changes in the factors affecting it. Distinguish:
price elasticity of supply;
cross supply elasticity.
The theory of elasticity has broad practical significance: in taxation, the development of pricing strategies, etc.
Review questions
Is it possible to create market relations by the decision of the supreme power?
Is there absolute economic freedom?
Can it be argued that competition helps to stabilize the economy?
Formulate the law of demand and the law of supply. Does the “ceteris paribus” principle apply in this case?
What is the difference between the action of the price factor and non-price factors of supply and demand?
Why is the demand for salt inelastic (in terms of price)?
What goods should be classified as good when analyzing the income elasticity of demand?
Give examples of the practical use of the theory of elasticity.
Abstraction
Normative approach
10) On the chart, the initial market equilibrium corresponds to point A. If the price rises to the level of P = 33, then the surplus of goods will be ...
about 10
7 = 31-24 = s2-d2
11) The chart shows the AD-AS (Aggregate Demand - Aggregate Supply) pattern.

Decline in aggregate demand in the long run ...
Has no price
Will reduce the real volume of production
Reduce prices
12) The chart shows the AD-AS (Aggregate Demand - Aggregate Supply) pattern.

If the aggregate demand curve crosses the aggregate supply curve in the intermediate section, then the increase in aggregate demand….
Will not change the real volume of production
Will not change the price level
Will raise the price level
Will increase the real volume of production

will not change the volume of production
reduce production
will lower the price level
will not change the price level
Task 20.1 The graph shows the function of supply and demand in a certain national market. It is known that the government has decided to set the highest possible price level.

The purpose of such intervention in the established market equilibrium can be….
Increasing the availability of goods for consumers
Reducing the likelihood of ruining sellers
Increased consumption of goods
Limiting the volume of consumption of goods
Backside 20.2. Markets are examples of markets that require such interventions in the established market equilibrium ...
Of bread
Articles made of precious metals
Public transport services
Grains
Back. 20.3. The result of the introduction of a price ceiling of CU 40 less than the equilibrium price, there will be a shortage of goods equal to 7 thousand pcs. (d-s = 11-4 = 7)
19) The figure shows a graphical model of the income and costs of a monopolist firm

Then the degree of its monopoly power (Lerner coefficient) will be:
- 0,5385 L = (P - MC) / P = (130-60) / 130 = 0.5385
- 1,1667
Solution: Most often, to characterize the degree of market power, the Lerner coefficient is used, defined as the ratio of the excess of the price of a product over the marginal costs of its production and the price of the firm:  , where P is the unit price, MC is the marginal cost.
It ranges from zero for perfect competition to one for monopoly. In this case, the optimal volume of production (Q) for the firm is 35 thousand units, since the marginal revenue (MR) and marginal cost (MC) become equal (60 monetary units) for a given Q. This volume of production will be sold at the price 130 days units
19.1) The figure shows a graphical model of the income and costs of a monopolist firm (see above)
Then the monopoly profit at the optimal volume of production will be equal to ___ thous. monetary units
+ 2450 = (200-130)*35
55) The figure shows a graphical model of the income and costs of a monopolist firm.

Then the degree of its monopoly power (Lerner coefficient) is ...
+ 0,4375
- 0,125
55.1) The figure shows a graphical model of the income and costs of a monopolist firm.
Then the monopoly profit at the optimal volume of production is equal to ___ thousand monetary units.
- 1600
55) The figure shows a graphical model of the income and costs of a monopolist firm:

Then the monopoly price for the optimal volume of production is = 60 Solution:
Any firm, including a monopoly, optimizes production from the standpoint of maximizing profits when marginal revenue (MR) and marginal costs (MC) are equal. The optimal production volume and sales price are determined finding the point of intersection of the MR and MC graphs, but the price (P) is determined by the restoration from this point of the perpendicular up to the demand line, which is identical in this case to the price, and the volume of production (Q) - by lowering from this point of the perpendicular down to the horizontal coordinate axis.
In this case, the optimal price level for the firm is 60 den. units, since the marginal income and marginal costs become equal at Q = 20 thousand pcs.
113) Based on the data on the inflation rate for three years, which amounted to 6.4 and 5.6 and 3.6%, respectively, we can conclude that inflation for the specified period was equal to ________%. = (1 + 0.064) * (1 + 0.056) * (1 + 0.036) -1 = 16.4%
+ 16,4
- 124, 7
5,2
10) Based on the data on the inflation rate for three years, which amounted to 3.4, 2.8 and 1.6%, respectively, it can be concluded that inflation for the specified period was equal to ________%.
- 8
13) Based on the data on the volume of production of prices for goods, we can say that the consumer price index in 2012 was _________ monetary units. , if in 2011 we take as the basic


0,998
1,035
1,077
1,113
114) In the early stages of the economic development of society, when a person is completely dependent on the environment, he had a locally ... technological mode of production
Producing
Appropriating
Simple
Constant
oligopoly
monopoly
monopolistic competition
monopsony
6) In the market for factors of production, a capital good is understood ...
a. profit
b. value generating income
v. physical capital
d. money capital
The market price was set at 131 thousand rubles. per item. The company is characterized in the calendar period by the relationship between the volume of production (pcs.), Variable and fixed costs (thousand rubles) (data in the table)
This figure refers to a type of structure such as 
Oligopoly
Monopoly
Monopolistic competition
Perfect competition
The market price was set at 131 thousand rubles. per unit of goods. the company is characterized in the calendar period by the relationship between the volume of production (units), variable and fixed costs (thousand rubles) (data in the table)

According to the data in the table, the size of the maximum possible profit of the company is
Answer: 1179 – 100 – 780 = 299
62) National economic systems have a lot in common with each other, but at the same time they differ in many ways. The development of economic systems is largely determined by scientific and technological progress, which is reflected in the level of development of the productive forces. Accordingly, distinguish between pre-industrial, industrial and post-industrial countries.
Industry is the leading sector of the economy in _____________ economic systems.
Closed
+ industrial
Open
Postindustrial
63) National economic systems have a lot in common with each other, but at the same time they differ in many ways. The development of economic systems is largely determined by scientific and technological progress, which is reflected in the level of development of the productive forces. Accordingly, distinguish between pre-industrial, industrial and post-industrial countries.
In post-industrial economies, the main production resources are ...
Capital
- information
+ knowledge
64) National economic systems have a lot in common with each other, but at the same time they differ in many ways. The development of economic systems is largely determined by scientific and technological progress, which is reflected in the level of development of the productive forces. Accordingly, distinguish between pre-industrial, industrial and post-industrial countries.
Establish a correspondence between the types of national economic systems and countries, depending on the level of development of production forces in them.
1. Pre-industrial economy
2. Industrial economy
3. Post-industrial economy
3) Netherlands
Greenland
1) Tanzania
2) Azerbaijan
112 National defense is an example of a _____ good.
Mixed private
Clean public
Mixed public
Purely private
113) The impossibility of meeting the needs of all members of society at the same time and in full is defined in economic theory as ...
1) limited resources
2) excessive needs
3) dominance of pseudo-needs
4) lack of natural resources
39) The inability of sellers, when demand changes, to increase or decrease the amount of sales in a situation of the shortest equilibrium is explained by the fact that the supply is ...
Elastic
Inelastic
+ absolutely inelastic
Completely elastic
The immovable character is a characteristic of the factor of production ...
+ Earth
- Capital
40) Uncertain market barriers to entry into the industry are typical for ...
Monopoly
Oligopolies
Monopolistic competition
+ Perfect competition
41) Insurmountable market barriers to entry into the industry are characteristic of ...
Monopolistic competition
Oligopolies
+ monopolies
Perfect competition
87 Unexpected inflation leads to a redistribution of wealth from ...
States to business
+ Spheres of production to trade
Borrowers to Lenders
Lenders to borrowers
13) The opposite indicator of the economic efficiency of the use of fixed capital is….
Return on assets
Materialism
Material efficiency
Capital intensity
18) The general pattern of sectoral shifts in the economy consists in a noticeable ...
Decrease in the share of the service sector
Increase in the share of the extractive industries of the economy
- a decrease in the share of extractive industries of the economy
- an increase in the share of the service sector
19 A society in which industrial relations are based on the use of information as a factor of production is called ...
Humanistic
Industrial
Instrumental
Postindustrial
132) Social relations that develop in the process of reproduction are manifested in the form ..
Material and technical ties
Organizational and economic relations
+ socio-economic relations
Substance-energy sacred
123) The general subject of research of mercantilists, physiocrats and classics is ...
Achieving General Macroeconomic Equilibrium
Study of economic institutions
Search for the reasons for the wealth of society
Monetary circulation and the fight against inflation
132) The object of purchase and sale in the financial capital market is ...
Securities
Machinery and equipment
Raw materials and supplies
Rights of disposal of valuables
133) The amount of investment directly depends on .. (at least 2 options)
+ real national income
+ real interest rate
Euro exchange rate
Amounts of rent
75) The amount of investment does not depend on ...
Expected rate of net profit
Economic expectations
Real interest rate
+ national currency rate
123) The volume of family savings in the year before last amounted to 6400 den. units, in the past - 6800 den. units If it is known that the marginal propensity to consume is 0.6, then the increase in disposable income was ______ den. units = (6800-6400) / (1-0.6) = 1000
124) The volume of savings last year amounted to 500 monetary units. At the end of the current year (over the same period), savings increased by 150 monetary units. If the average propensity to save is 50%, the disposable income is ____ monetary units.
300
1300
78) The object of the modern labor market is ...
Ability to work
Employer
Wage
Worker
58) The volume of savings last year amounted to 460 den. units At the end of the current year (for the same period), savings increased by 49 den. units If the average propensity to save is 40%, then the disposable income of the current period is ___________ monetary units.
+ 203,6 aps = s / y
- 1027,5
94) One of the reasons for the existence of a natural level of unemployment is
Developed labor market infrastructure
Sustainability of wages
Lack of structural changes in the economy
a) costs of production and sale of products
b) fixed and variable costs
c) the cost of purchasing equipment
Fixed costs are the costs of
a) salaries of management personnel, security, interest on loans, depreciation
equipment
b) the salary of workers, security, the cost of raw materials and equipment
c) remuneration of employees, depreciation of equipment, rent
d) raw materials, electricity, interest on the loan
An increase in a firm's variable costs can occur as a result of an increase in
a) interest rates on bank loans
b) local taxes
c) raw material prices
d) rent for the equipment of the company
Average total costs are minimal when
a) they are equal to marginal costs
b) the total output is minimal
c) the total output of products is maximum
d) variable costs are minimal
Option number 8
Exercise 1.Describe the structure of production. Present the answer in the form of a table.
Task 2. To solve the task.
The costs of a monopoly firm are described by the function The demand function for the firm's products is presented in the form, then the degree of its monopoly power (Lerner's coefficient) is ...
Task 3. To solve the task.
During the reporting period, the volume of savings increased by 400 den. units, while disposable income increased by 1300 den. units Under these conditions, the multiplier of autonomous expenses is ...
Task 4. Case task.
The graph shows the function of supply and demand in a certain national market. It is known that the government has decided to set the highest possible price level.

a) The purpose of such intervention in the established market equilibrium can be….
Increasing the availability of goods for consumers
Reducing the likelihood of ruining sellers
Increased consumption of goods
Limiting the volume of consumption of goods
b) Markets are examples of markets that require such interventions in the established market equilibrium ...
Articles made of precious metals
Public transport services
Task 5.
An example of a natural monopoly is
b) publishing house "Kommersant"
c) Moscow metro
d) the firm "Red October"
Unlike a competitive firm, a monopolist
a) can set any price for his product
b) maximizes profit when marginal revenue and marginal costs are equal
c) can produce any volume of products and sell them at any price
d) for a given market demand curve, he can choose a combination of price and volume
issue that gives the maximum profit
The only seller facing many buyers
a) trades only in homogeneous goods
b) focuses on the needs of buyers
c) dictates prices
d) does not take into account the behavior of its customers
Anti-monopoly legislation is primarily aimed at ensuring
a) the prohibition of monopolies
b) economic freedom
c) equal conditions of competition
d) price regulation
In the market of monopolistic competition
a) an individual buyer can influence the price of a product
c) goods differ in performance and terms of sale
d) there is only one manufacturer
Option number 9
Exercise 1... Describe the forms and types of property. Present the answer in the form of a table.
| Varieties of forms of ownership | Specific traits | Ownership and business forms | |||
| Private property | |||||
| Individual property (private labor) | |||||
| Capitalist private property | |||||
| Collective ownership | |||||
| Cooperative property | |||||
| Share ownership | |||||
| Partner property | |||||
| Public property | |||||
| State property | |||||
| Property of public organizations | |||||
Task 2. To solve the task.
The income, expenses and savings of the consumer for two years are presented in the table.
Based on the data presented, we can say that the average propensity to save in 2009 was
Task 3. To solve the task.
If the nominal GNI increased from 3500 billion. units up to 3850 billion den. units, and the price level for the same period increased by 4%, then the real GNI ...
Task 4. Case task.
In the fitness services market, the functions of individual demand of two corporate consumers for subscriptions to a fitness club are as follows: Qd1 = 90-2P; Qd2 = 210-3P.
The function of the market offer of subscriptions has the form Qs = -20 + 35P, where Qd1 and Qd2 are the demand of the first and second corporate consumers for a subscription per month (units), Qs is the supply of subscriptions per month (units), P is the price of a subscription (thous. rub.).
The market demand function Q D for subscriptions to a fitness club will look like ...
Task 5. Tests. Choose the correct answer.