Feel. Methods for studying sensations
Read also
Method No. 1 “Superimposed objects”
Target:
The child is asked to recognize all the images superimposed on each other and give each of the objects a name.
Instructions: Now we'll play with you. Do you like to play hide and seek? I have interesting pictures that also decided to play hide and seek with you. Let's find them with you.
Analyzed indicators:
1. Availability of task completion
2. The presence of fragmented perception
3. Possibility of selecting a complete figure
4. Presence of paragnosis
5.Image selection strategy
Method No. 2 “recognition of crossed out images”
Target: study of the characteristics of visual perception for preschool children.
The child is asked to recognize the crossed out object on the sheet and give it a name. It is advisable not to show which object to start with, since this allows you to discover perception strategies.
Instructions: Look at these pictures. What objects do you see there?
Analyzed indicators:
1. Possibility of recognition of crossed out images
2. The ability to adequately highlight the figure (stability
visual image of an object)
3. Strategy for image direction (right to left, left to right, chaotic or sequential)
Method No. 3
Purpose: study of auditory perception.
Equipment: Several musical instruments.
a) The child is asked to determine which toy sounded: look and
listen to the sound of two different instruments. Then baby
turns away, the researcher causes the sound of one toy.
Turning around, the child shows which toy sounded, or if, perhaps,
calls her.
b) The child must determine by ear the direction of the sounding toy.
The researcher behind the child causes the sound of one toy above,
below, right, left.
The child points in the direction of the sounding toy.
Appendix No. 3 to laboratory work No. 1
Methods for studying memory.
“Remember a couple” technique.
Study of logical and mechanical memory by the method of memorizing two rows of words.
Required material: two rows of words. In the first row there are semantic connections between the words; in the second row they are absent.
First row
doll - play
chicken - egg
scissors - cut
horse - sleigh
book - teacher
butterfly - fly
brush - teeth
drum - pioneer
snow - winter fish - fire
cow - drank milk - scrambled eggs
Progress of the task. The experimenter reads to the subject(s) 10 pairs of words from the series under study (the interval between pairs is 5 seconds). After a 10-second break, the left words of the row are read (with an interval of 10 seconds), and the subject writes down the remembered words of the right half of the row.
Processing job data. The results of the experiment are recorded in the table:
Methodology “Memorizing two groups of words.”
Exercise: the child is asked to memorize a series of words and then repeat them.
Instructions: repeat after me: ... The child repeats. Repeat the words again...
Then the researcher asks what words were in the first group, then in
second. If the child cannot sort the words into groups, then ask
what kind of words were there?
If the task is not completed correctly, it will be played up to 4 times.
After this, interference is carried out for 3-5 minutes. Upon completion
interfering task, the child is asked to repeat the words that were
given in the first and second groups, without their presentation.
House, forest, cat - night, needle, pie
Whale, sword, circle - ice, flag, notebook
Faucet, pillar, horse - laziness, pine, water
Glue, beam, cube - throne, fur coat, vase
Interpretation: the norm is considered to be direct, full-fledged
playback for the third time. Strength of auditory-verbal memory at
delayed reproduction of words is considered normal if 2
errors (for example, 2 words were forgotten, or 1-2 replacements were made for words
similar in sound or meaning, the arrangement of words is mixed up
groups).
“10 words” technique
Instructions: " Now I will read you a series of words, and you will try to remember them. Get ready, listen carefully:
table, soap, man, fork, book, coat, axe, chair, notebook, milk
A number of words are read several times so that children remember... The long-term memory coefficient is calculated using the following formula:
C = V/A X 100%
A is the total number of words,
B - number of words remembered,
C - long-term memory coefficient.
The results are interpreted as follows:
75-100% - high level;
50-75% - average level;
30-50% - low level;
below 30% is a very low level.
This technique was carried out with a 5-year-old child. In kindergarten from 3 years old. Diagnosis: mental retardation, level 3 ODD.
R examination results I
| table | soap | Human | fork | book | coat | axe | chair | notebook | milk | |
| + | + | + | + | |||||||
| + | + | + | + | + | ||||||
| + | + | + | + | + | + | |||||
| + | + | + | + | + | + |
Conclusion: the child showed an average level of memory development. This indicates the effectiveness of the corrective work carried out with him.
Memory technique.
Research objective. Determination of absolute sensation and its characteristics in different individuals.
Equipment.
- 1. Landolt rings (Fig. No. 1) a round tablet, on a white background on which is drawn a black ring 1.5 mm thick with an internal diameter of 7.5 mm and a gap of 1.5 mm. The ring is mounted on a slightly larger, also white square base (in the center), which can be hung on the wall.
- 2. Centimeter tape measure.
Research procedure. It is carried out with several persons, in a well-lit room and must be the same for all subjects. Subsequent studies should be absent from previous studies.
Instructions for the subject.
“I will hang on the board these tablets with a circle with a gap on it. Now stand at the end of the room, at a distance of slightly more than 5 m, and turn your back to me. When I give the command “Begin!”, turn around and slowly approach the board, try to see the ring facing the gap in the full direction. As soon as you see it, stop, put your hand in the direction of the gap and do not move. Got it?... Start!”
Accounting for results.
When observing, it is necessary to determine whether the person being studied should peer calmly or intensely into the object.
During the survey, find out when he stopped: having completely clearly seen the gap or just guessing, quantitative indicators are obtained by measuring the distance (in centimeters) from which the subject first correctly saw the direction of the gap; for all subjects, it should change with each repeated experiment. The experiment is repeated 5 times.
Analysis of results.
The method makes it possible to assess the change in the threshold of visual sensation in the subject as a result of fatigue and determine its difference in different individuals. The greater the distance from which the subject saw the directions of the rupture, the lower his absolute threshold of visual sensation and the higher his sensitivity.
The basis of knowledge about the world around us is sensations. Sensation is a reflection of the properties of objects of the objective world that arises in a person when they directly influence his senses. Sensations arise as a result of the transformation of the specific energy of stimuli into the energy of the nervous processes of the body. The physiological basis of sensation is a nervous process stimulated by the action of a particular stimulus on an adequate analyzer. The sensation is reflexive in nature.
The afferent systems of our body can reflect the state of both the external world around us and the state of our own body with greater or less accuracy, that is, they can be more or less sensitive. Experimentally, it is possible to establish the minimum intensity of any stimulus, the action of which produces a minimal, barely noticeable sensation. The founder of psychophysics, G. T. Fechner, called this minimum intensity of the stimulus the absolute threshold of sensitivity of the sense organs. There is an inversely proportional relationship between the absolute threshold of sensitivity and the sensitivity of the sensory organs: the lower the threshold, the higher the sensitivity. Formally, this can be written as follows:
Where E- sensitivity; R.L.- absolute sensitivity threshold.
Through the senses, a person can not only detect the presence of a particular stimulus, but also distinguish between stimuli by their quality and strength. The minimum difference between two stimulus intensities that causes a noticeable difference in the intensity of sensation is called the discrimination threshold or difference sensitivity threshold and is designated D.L..
Inversely proportional to the difference sensitivity threshold is the so-called difference sensitivity, denoted E d: the lower this threshold, the higher it is:
The German physiologist E. Weber back in the 19th century. experimentally proved that the value of the difference sensitivity threshold is relative, since the ratio of the value of the minimum additional stimulus (D R) to the initial stimulus value ( R) - constant value:
Based on this law and accepting the postulate that the increase in intensity can be represented as an infinitesimal value, Fechner expressed the dependence of the change in the intensity of sensation on the strength of the physical stimulus with the following formula:
E d = c log r,
Where E d - difference sensitivity; With- constant for the transition from natural logarithms to decimal ones; r- ratio of the magnitude of the active stimulus ( R) to the value of the absolute sensitivity threshold ( R.L.), i.e.
G. Fechner formulated the psychophysical law as follows: the magnitude of the sensation is proportional not to the absolute value of the stimulus, but to the logarithm of the magnitude of the stimulus, if this latter is expressed through its threshold value, that is, the latter value is considered as the unit at which the sensation appears and disappears.
The values of both absolute and differential sensitivity thresholds largely depend on the conditions of their measurement. The most important factor that determines the value of the mainly absolute sensitivity threshold is the level of adaptation of the sensory organ (and the entire analyzer) to the measurement conditions. Adaptation refers to the adaptability of the analyzer to changing external conditions. The influence of adaptation of the sensory organs on changes in the value of the absolute threshold of sensitivity can be demonstrated using the example of visual dark and light adaptation of the eye (see Lesson 2.2).
G. Fechner proposed a number of methods for measuring absolute and differential sensitivity thresholds. They accurately measure the intensity of a stimulus that produces a subtle sensation or subtle change in sensation. The difference between these methods lies mainly in the method of presenting the stimulus, as well as in the method of statistical processing of the primary research results.
Methods for determining absolute sensitivity thresholds. First of all, let's look at the method of minimal changes, or the method of boundaries. The main content of the method is reflected in its name: the selected continuum of stimuli must be presented in such a way that the discrete values of this continuum differ from each other by the minimum possible amount. The presentation of stimuli alternates in ascending and descending order. For each sequence of stimulus presentation, the boundary for changing responses is determined (such as “yes / no”, “I see / I don’t see”). Typically, the threshold measurement begins with a decreasing series of stimuli, taking the value of a clearly perceived stimulus as the initial value. It is believed that the threshold, i.e., the magnitude of the stimulus at which a change in the subject’s responses occurred, is in the middle of the interstimulus interval - between the stimulus that is still perceived and the one that is no longer perceived. The threshold is determined similarly for an increasing series of stimuli. The boundaries for changing the category of responses in ascending and descending series of stimuli most often do not coincide. This occurs due to the occurrence of so-called systematic errors in the subject - errors of habituation and errors of expectation. Each ascending and each descending sequence of stimuli is repeated in one experiment from 6 to 15 times. Beyond the absolute threshold of sensitivity ( R.L.) take the arithmetic mean of the values of all thresholds of appearance and thresholds of disappearance found during the study:
Where R.L.- average absolute sensitivity threshold; L- the threshold value in each stimulus series - both ascending and descending; N- total number of stimulus rows. The variability of the subject's responses is assessed using the standard deviation ( s). The error that must be made if the experimentally found estimate of the absolute threshold is considered as its true value is called the standard error of the mean:
s RL = ,
Where With- standard deviation of the value R.L.; a N- sample size.
Another method used to determine the absolute threshold of sensitivity is the method of constant stimuli, or the method of constants. This method requires a preliminary experiment, the purpose of which is to approximately determine the range of the threshold zone. The threshold zone is a range of stimulus intensity at the boundaries of which the subject almost always begins or ceases to feel the impact of the stimulus. The range of the threshold zone identified in the experiment is divided into an equal, preferably odd, number of intensity intervals (from 5 to 9). Therefore, all differences between the values of all stimuli in the threshold zone are the same. During the entire experiment, these selected intensities remain unchanged (hence the name of the method: the method of constants). During the experiment, stimuli of different intensities are presented in a random order, and stimuli of each intensity must be presented the same number of times.
At processing of experimental data In order to determine the absolute sensitivity threshold, it is advisable to adhere to the following sequence.
2. Convert these absolute response frequencies into relative frequencies ( f), which is carried out by dividing the number of positive responses by the number of presentations of a given stimulus.
3. Construct a coordinate system, on the abscissa axis of which we plot the intensities of the affected stimulus, and on the ordinate axis - the relative frequencies of the subject’s positive responses ( f) - from 0.0 to 1.0.
4. Plot the experimentally obtained values for all stimulus intensities on the graph and connect the experimental points using straight line segments.
5. From the points on the y-axis corresponding to the frequency of positive answers ( f = 0,50, f= 0.25 and f= 0.75), draw straight lines parallel to the x-axis until they intersect with the experimental curve and mark the intersection points as 1, 2 and 3, respectively.
6. By projecting point 1 onto the x-axis, find the value of the median on it, and by projecting points 2 and 3, find the value of semiquartile deviations. Magnitude Me(projection of point 1) will correspond to the absolute sensitivity threshold, a Q 1 and Q 3 (projections of points 2 and 3) - the zone of uncertain answers of the subjects.
Greater accuracy in graphically determining the median and semiquartile deviations can be achieved by constructing a curve of accumulated frequencies *.
* Along with graphical interpolation of the median and semiquartile deviations, these values can be determined using the corresponding algebraic formulas (4, pp. 208-228).
When the results of a study obey the law of normal distribution, the values of the arithmetic mean ( ( Ms).
Finally, the average error method is used to determine the absolute sensitivity threshold. However, its use is advisable only in cases where it is possible to continuously (smoothly) change the presented stimulus. When measuring using this technique, the subject himself regulates the magnitude of the stimulus. Starting from the one that initially caused him a distinct sensation, he gradually reduces the intensity of the stimulus until he establishes its value at which he first loses the feeling of its impact. If the experience begins with a clearly imperceptible intensity of the stimulus, then the subject must find its value at which the sensation appears.
When processing the results obtained, measures of central tendency are used as indicators of the absolute sensitivity threshold - the median ( MeM).
Methods for determining difference sensitivity thresholds. First of all, let us dwell on the features of using the method of minimal changes, or the method of boundaries, in order to determine difference thresholds. Although the entire measurement procedure remains essentially the same as for absolute threshold measurement, some changes must be made to it. The main one is due to the fact that determining the difference threshold involves choosing a reference stimulus among a continuum of supra-threshold stimuli. All other stimuli are compared in relation to it. Comparison of the reference and other, i.e., variable, stimuli can be carried out sequentially or simultaneously. In the first case, the reference stimulus is presented first, and in the second case, the reference stimulus and the variable stimulus compared to it are presented simultaneously. Using the boundary method to determine difference thresholds requires taking into account not two, but three categories of the subject’s answers: “more,” “less,” and “equal.” When processing experimental data for each stimulus series, boundaries are found between the change in response categories, namely: from “less” to “equal” and from “equal” to “more.” By averaging the values of stimulus intensities corresponding to the intervals between these boundaries (together for descending and ascending series of stimulation), the average values of the “upper” (for responses “more”) and “lower” (for responses “less”) sensitivity thresholds are obtained. The difference between them determines the interval of uncertainty, that is, the zone of the stimulus series in which “equal” responses predominate. The value of the uncertainty interval, divided in half, gives us the desired value of the difference sensitivity threshold.
The stimulus located at the midpoint of the uncertainty interval is always assessed by the subject as equal to the standard, that is, it acts as a subjective equivalent of the standard. The magnitude of this stimulus is calculated as half the sum of the upper and lower thresholds. In psychophysics, this value is called the point of subjective equality. Since the point of subjective equality does not coincide with the value of the objective standard, the difference between one and the other indicates the value of the constant error (CE) of the subject. When the subject overestimates the standard, the constant error has a positive value, and when underestimated, it has a negative value.
The basic prerequisites for determining difference thresholds by the method of constant stimuli, or the method of constants, remain the same as when determining the absolute sensitivity threshold. However, it is natural that the difference threshold is determined in relation to an arbitrarily selected standard stimulus of suprathreshold intensity. In the measurement process, you can use an experimental plan according to which two categories of answers are required from the subject (both “more” and “less” than the standard). But you can use another plan that provides three categories of answers (similar to the boundary method). However, the second version of the technique is used less frequently, since the presence of a third category of answers (“equal to the standard”) in it contributes to the preference of subjects for this particular category of answers, which leads to a decrease in the accuracy of the obtained measurement results. In order to process experimental data obtained using only two response categories (“more” and “less”), a psychometric curve is constructed, similar to how it was described for measuring absolute thresholds using the same technique.
To characterize the results of measuring difference thresholds, measures of central tendency are used - median ( Me) and the arithmetic mean ( M), and as a measure of variability - semiquartile deviations ( Q 1 and Q 3) and standard deviation ( s). When measuring difference thresholds using the method of constants, the median is equal to the point of subjective equality, and the constant error of the subject is the difference between the values of the median and the reference stimulus value. The difference sensitivity threshold in such an experiment corresponds to half the uncertainty interval. It is calculated using semiquartile deviations:
Consequently, the difference sensitivity threshold is characterized by the measure of the scatter of experimental data.
When measuring the difference sensitivity threshold using the average error method, the subject is presented with two stimuli simultaneously - a standard and a variable stimulus, and the subject changes the value of the variable stimulus independently. The equipment must allow smooth adjustment of the measured parameter of the variable stimulus. The subject's task is to compare the variable stimulus to the standard. To calculate the difference threshold, the subject must make many adjustments, which makes it possible to calculate the arithmetic mean ( M) and standard deviation ( s) trimming accuracy. In an experiment using the average error method, the value of the difference sensitivity threshold largely depends on the wording of the instructions given to the subject. The subject can be asked to compare the variable stimulus relative to the standard, saying that the variable stimulus will, for example, always be less (or always more) than the standard. In this case, most often the arithmetic mean value of the measurement results will be shifted relative to the reference stimulus value. The difference sensitivity threshold in this case will be determined by the difference between the standard value and the arithmetic mean of all measurements. However, this method of measuring the difference sensitivity threshold is not accurate enough, since the calculation takes into account only one part of the uncertainty interval in which the sensitivity threshold is located. Therefore, most often the subject is given a different instruction, namely “to find equality between the variable and the reference stimuli.” When the subject is alternately aligned with noticeably larger and noticeably smaller variable stimuli than the standard, we obtain a bimodal distribution of measurement results. Separate calculation and analysis of the arithmetic mean values ( M) and standard deviation ( s) for trimming, where the variable stimulus was larger and smaller than the standard, allows us to determine the uncertainty interval, and half of this interval will characterize the value of the difference sensitivity threshold.
Lesson 2.1 DETERMINATION OF THE BORDERS OF VISUAL FIELDS AND FUNCTIONAL ASYMMETRY OF THE EYES (USING THE FÖRSTER PERIMETER)
Introductory remarks. The field of view refers to the space visible to the eye when fixating a fixed point. Its value is determined by a number of factors, including the anatomical features of a person’s face. Normally, the field of view is limited from above (superior direction) to 55°, from inside (nasal direction) and below (inferior direction) - 60°, from outside (temporal direction) - 90°. These values are the limits of normal visibility of an achromatic stimulus. For chromatic stimuli, the visual field is narrowed. When measuring the visual fields of the right and left eyes separately, the boundaries of the visual fields may not coincide. If we exclude random measurement errors (for verification, a statistical assessment of the significance of the differences is made), we can assume the presence of functional asymmetry of the visual fields.
The task requires determining the field of view for all four directions: temporal, nasal, superior and inferior. To measure the boundaries of the visual field, it is advisable to use the psychophysical boundary method. During the experiment, the stimulus label is first moved from the periphery of the visual field to the center, which corresponds to an ascending series of stimulation. Movement continues until the subject is notified of the appearance of a mark in his field of vision. Then the mark is moved in the opposite direction - from the center to the periphery, which corresponds to a descending series of stimulation. This is also done until the subject reports that the mark has disappeared. When presenting chromatic stimuli, care should be taken to ensure that the subject correctly names the color of the stimulus. It must be remembered that as the stimulus mark moves from the center to the periphery, the color of the stimulus visible to the test subject may change. A similar change in the color of the stimuli is observed when the mark moves from the periphery to the center. The moment the stimulus color changes is the boundary of the visual field for a chromatic stimulus.
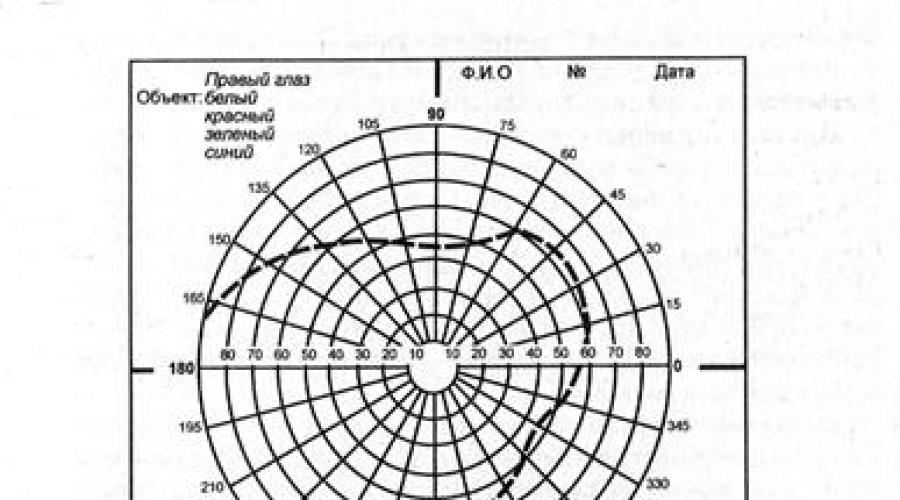
Hardware and equipment. To carry out practical work, it is necessary to have the G. Förster perimeter or the projection perimeter of the PrP with a set of achromatic and chromatic (red, green and blue) stimuli, ready-made forms for designating visual fields (Fig. 2.1.1) and a protocol form prepared in advance (form 1).
CLASS PROTOCOL * Form 1
Assignment (topic) ................................................... ............……………………..Date of........................... .........……………………
Experimenter................................................. ........................................................ ........................................………………
Recorder......................................................... ........................................................ ................................................…… …………
Subject........................................................ ........................................................ ................................................…… …………
The well-being of the subject (attention should be paid to all complaints: fatigue, visual fatigue, etc.)................................... ........................................................ ........................................................ ....……….……………………………
Measured eye (right, left) .................................................... ........................................................ .....……………………….
Type of stimulus (achromatic, chromatic - red, green or blue) .................................................... ….………….
.....................................................................................................................................................…………………..
Perimeter arc values (in degrees)
(records are taken by a protocol officer)
* In each task in this section, the lesson protocol should begin with information similar to the following.

Rice. 2.1.1. Standard form for determining the boundaries of visual fields.
Numbers: horizontal digitization – angle (in degrees) on the perimeter arc, circular digitization – angle (in degrees) of rotation of the perimeter arc; broken line– normative boundaries of the visual field for achromatic stimuli.
Before starting the experiment, it is necessary to prepare eight such protocol forms: two for measuring the boundaries of the visual fields of achromatic stimuli and two for determining the boundaries of the visual fields for each of the three chromatic stimuli.
Operating procedure. The experiment involves an experimenter, a protocolist and a subject. The subject sits at the device and places his chin on the chinrest. His eyes should be at the level of the fixation point of the perimeter arc, located in the center of this arc. The subject's unmeasured eye is covered with an eyecup. Before starting measurements, the experimenter must familiarize the subject with the instructions.
Instructions to the subject:“There is a small white dot right in front of you in the center of the perimeter arc. You need to strictly fix her gaze throughout the entire experience. A white (or red, green, blue) stimulus mark will move along the perimeter arc. As soon as the stimulus appears in your field of vision, as well as when it disappears, you inform the experimenter about it. If chromatic stimuli are presented, you will notice a change in the color of the stimulus, which you will also have to report. Remember to strictly fix your gaze on the fixation point in the center of the perimeter.”
The experimenter moves smoothly (at a speed of approximately 2 cm/s); stimulus mark along the inner surface of the perimeter arc until the moment when the subject first notices it. With each message, the protocol officer records the value of the perimeter arc (in degrees) in the protocol. Measurements for the temporal and nasal directions are made with a horizontal position of the perimeter arc, and for the upper and lower directions - with a vertical position, for which the arc is rotated 90°. When measuring the boundaries of the visual field, it is necessary to obtain 10 responses from subjects for each direction, 5 for the appearance and 5 for the disappearance of the stimulus. Accordingly, for chromatic stimuli: 5 responses when the mark moves from the center to the periphery and 5 - from the periphery to the center.
Processing of experimental data. To determine the boundary of the field of view in each direction it is necessary.
1. Calculate the arithmetic mean ( M).
2. Determine the standard deviation ( s).
3. Determine the error of the average ( s M).
4. Assess the statistical significance of the differences in the values of the boundaries of the visual field for all measured directions of the left and right eyes using the Student t-test (see Appendix I on p. 274).
5. On the visual field forms, plot separately for the right and left eyes the values of the arithmetic mean ( M) across all dimensions measured and for all stimulus uses. Connect the points with straight line segments.
Analysis experimental data consists of indicating the features of the boundaries of the visual field within the studied directions for a given subject. It is necessary to pay attention to possible deviations from standard values for both achromatic and chromatic stimuli.
Control questions
1. Define field of view.
2. What factors (in your opinion) determine the size of the field of view?
3. What type of scale can the obtained experimental data be classified as?
4. Prove the validity of the statistical indicators you used ( M, s, s M, t-criteria).
Lesson 2.2 STUDY OF THE DYNAMICS OF ABSOLUTE THRESHOLDS OF LIGHT SENSITIVITY UNDER DARK ADAPTATION CONDITIONS (USING AN ADAPTOMETER)
Introductory remarks. Adaptation is defined as the adaptation of the level of sensitivity of a sensory organ to the changing intensity of the influencing stimulus. The human eye's ability to adapt allows it to respond adequately to a wide range of light intensities. Thanks to the functioning of the rod apparatus, the eye perceives very weak light stimuli (from 1×10 -9 to 1×10 -4 lmb) *, and thanks to the functioning of the cone apparatus, very strong ones (from 1×10 -7 to 10 lmb).
* Lambert is a unit of measurement of luminous flux intensity.
The purpose of this work is to construct a dark adaptation curve and track the rate of change in light sensitivity of the eye under dark adaptation conditions. To do this, it is necessary to measure the absolute threshold of light sensitivity at strictly specified time intervals. Let us recall that the reciprocal value of the threshold characterizes the sensitivity of the sensory organ. To carry out measurements on the basis of which the absolute threshold of light sensitivity can be calculated, the most adequate psychophysical method is the method of minimal changes. Since the range of measured values and discreteness of units of measurement are specified by the scale of the device, the protocolist records in the protocol only the magnitude of the stimulus that causes a change in the answer (“I don’t see/I see”).
Hardware and equipment. Measurements are made using a medical device adaptometer type ADM-01, the description of which is given in the instructions attached to the device *. To work with this device, the experimenter needs to know its basic technical and design features.
* A description of the device is also given in the manual: Workshop on Psychology / Ed. A. N. Leontyeva and Yu. B. Gippenreiter. M., 1972. S. 26-32.
The adaptometer consists of a ball of preliminary light and dark adaptation, a measuring device and a tripod with a chinrest. The preliminary adaptation ball serves, firstly, to establish the initial level of light adaptation set by the experimenter, and, secondly, to
presentation of the test object during measurement. The brightness of the ball can be discretely changed in the range from 2500 to 312 asb. * At an angle of 12° to the line of fixation of the subject’s gaze, there is a red fixation point on the test object, which the subject must fix with central vision during the entire measurement period. Thus, during measurements, the test object is projected precisely onto that area of the retina that has the maximum sensitivity of rod vision. The measuring device consists of a set of discrete light filters - Ф, calibrated in units of optical density (indices: 0.0; 1.3; 2.6; 3.9; 5.2), an additional neutral (gray) light filter (index 0.01 units of optical density) and measuring aperture - (D) with a logarithmic scale of units of optical density. The light transmission of the diaphragm is characterized by the ratio S/SU where C is the value of the area of opening of the diaphragm at the given position of the scale, and Cd is the value of the area of full opening of the diaphragm (mark 0 on the scale). A tripod with a chin rest is used to fix the position of the subject’s head during measurements.
* Apostilbe is a unit of photometric brightness: 1 asb = 10 -4 lmb.
Before starting measurements, it is necessary to prepare a form for the experiment protocol (Form 2).
CLASS PROTOCOLForm 2
(records are taken by a protocol officer)
STUDY METHODS
Experimental
Methods for studying sensations are associated with experiments, mainly physiological or psychophysiological.
Painful sensations have one feature, which can be noticed by easily pricking your finger. At first, a relatively weak, but precisely localized pain sensation occurs. After 1-2 seconds it becomes more intense. G. Head was first able to separate this “double sensation” in 1903. His sensory nerve was cut for experimental purposes. It was already known then that nerves can recover. Immediately after the transection, all types of sensitivity disappeared in the experimental area, which were restored at unequal rates. After 8-10 weeks, the first signs of recovery appeared; after 5 months, pain sensitivity was restored, but in a very peculiar way. A slight prick, even the touch of an assistant, caused an excruciating, almost unbearable feeling of pain. The subject screamed, shook his whole body, and grabbed the one who was causing the irritation. Moreover, if he was blindfolded, he could not tell where the sensation of pain arose. And only five years later the pain sensations were completely restored. This is how the doctrine of protopathic and epicritic sensitivity arose. Protopathic sensitivity (from the Greek protos - first and pathos - suffering)
represents the most ancient primitive undifferentiated low-level sensitivity, and epicpitic (from the Greek epikriticos - making a decision) is a highly sensitive and finely differentiated type of sensitivity that arose at later stages of phylogenesis.
Diagnostic
Diagnostic methods for studying sensations are mainly associated with measuring sensitivity thresholds and require the presence of special equipment.
Psychology of the personality of a military man. Methods for studying individual characteristics
1. Observation. 2. Study of documents. 3. Analysis of the practical activities of military personnel and units. 4. Discussion of issues at general meetings. 5. Individual educational work. 6. Round tables. 7. Questions and answers evenings. 8. Polls...
Memory properties
Experimental As an example of a research method, we give an example of a study of involuntary memorization by V.P. Zinchenko. The purpose of the study is to establish the dependence of involuntary memorization on the characteristics of the activity...
Group cohesion and performance
The technique for measuring group cohesion includes two closely related methodological approaches. The first is measuring the emotional attractiveness of group members...
Comparative characteristics of voluntary and involuntary memorization
2.1. Study of involuntary memorization and the conditions for its productivity Involuntary memorization is a memorization process that occurs against the background of activities aimed at solving non-mnemonic problems...
Strategies for overcoming loneliness among high school students
loneliness high school student teenager The choice of methods and specific research techniques in modern psychology is very diverse. As a rule, in practice several methods are used to increase the reliability of the result...
Theories and types of sensations
Experimental Methods for studying sensations are associated with experiments, mainly physiological or psychophysiological. Painful sensations have one peculiarity, which can be noticed by easily pricking your finger...
Feeling- this is the ability of the brain to reflect individual properties of objects and phenomena of the surrounding world and internal organs of the body that are currently affecting the senses. This is the primary level of information processing, called sensory.
With the help of sensations, a person reflects light, darkness, color, sounds, noises, temperature, smells, tastes, etc. Sensations arise as a result of the transformation of the specific energy of stimuli into the energy of the nervous processes of the body and are reflexive in nature.
Sensations provide material for other, more complex mental processes and, above all, for perception.
Methods for studying sensations, mostly experimental. Due to their specific nature, these studies can only be performed in laboratory conditions using special equipment. These are experiments to study sensitivity and its thresholds by E. Weber, G. Fechner, S.V. Kravkova et al., studies of light and dark adaptation, sensitization, assessment of absolute and relative sensitivity thresholds and many other patterns of sensations.
Perception- this is a reflection of integral objects and phenomena with their direct impact on the senses. During exposure to a stimulus (object, phenomenon), the subject forms holistic images of things and events. Perception is not reduced to the sum of individual sensations, since in addition to sensations it includes previous experience and processes of a more complex level (memory, thinking, etc.). It represents a qualitatively new stage of sensory cognition.
Perception is capable of reflecting the spatial characteristics of the surrounding world: location in space, distance from the subject, relief, shape and size. It can also reflect temporal characteristics: duration and time sequence. Genetically, the starting point in the process of forming a perception image is the reflection of the movement of an external object.
It is known that unchanging information is not retained in consciousness. Therefore, in order to better perceive an object, a person makes various perceptual movements: turns the object, feels, examines, smells or tastes it with his tongue.
To the main properties of perception include:
- modality, i.e. reflection of the qualitative characteristics of external stimuli and differences between analyzers (organs of vision, hearing, etc.);
- intensity- characterized by a reflection of the quantitative and energetic characteristics of stimuli.
Higher level properties include:
- objectivity– division of a single phenomenal field into clearly defined and stable objects;
- integrity- characterized by the fact that individual signs of an object, which are not actually perceived, nevertheless turn out to be integrated into the holistic image of this object. This effect is based on probabilistic forecasting of the dynamics of an object in the surrounding world.
- constancy- the relative stability of the perceived characteristics of objects when the conditions of perception change.
- structure - a property that allows one to perceive objects in the totality of their stable connections and relationships. We recognize various objects thanks to the stable structure of their features.
- categoricality perception presupposes that an object is perceived and thought not as an immediate given, but as a representative of a certain class of objects. In meaningfulness the connection between perception and thinking is manifested, and in generality – with thinking and memory.
When the process of perception is included in the processes of higher levels of mental reflection or in the structure of consciousness as a whole, perception acquires such new properties as:
- selectivity of perception consists in preferentially highlighting some objects (or some properties, features, qualities of objects) over others.
- meaningfulness- the property of human perception to attribute a certain meaning to a perceived object or phenomenon, designate it with a word, assign it to a certain linguistic category in accordance with the knowledge of the subject and his past experience.
Methods for studying perception. The main method for studying perception is experiment, especially laboratory experiment using certain equipment. Thus, the volume of perception, constancy, binocular vision and stereoscopic effect, illusions, etc. were studied.
LABORATORY WORK No. 6
Methodology “Specificity of Perception”
Target: establish the difference between sensations and perception during tactile recognition of objects.
Material and equipment: a set of small objects for tactile recognition (pin, key, cotton wool, etc.), blindfold, stopwatch.
Research procedure:
The study of tactile sensations consists of two series of experiments and is carried out with one subject.
First episode is aimed at establishing the characteristics of tactile sensations based on the subject’s verbal descriptions, caused by objects from the set during their alternate presentation on a stationary palm.
During the first series of the study, the subject is blindfolded and given the following instructions.
Instructions (first series):“Turn your hand palm up. During our research, you will feel some influences on your palm. Without making any palpating movements with your hand, give a verbal account of the sensations that you will experience. Say everything that you feel out loud.”
The experimenter sequentially presents objects for tactile recognition by the subjects. The presentation time for each of them is 10 seconds. After which the object is removed from the hand, and the test subject’s verbal report is recorded in the protocol.
Second series: is aimed at establishing the characteristics of tactile sensations from the verbal descriptions of the subject, when objects are placed one by one on his palm and he is allowed to feel them with the same hand.
The second series of studies is carried out two to four minutes after the first. In the second series, just like in the first, the subject is blindfolded and given instructions before presenting the items of the set.
Instructions (second series):“Turn your hand palm up. During our study, you will feel some influences. You are allowed to make palpating movements with your hand. Give a verbal account of the sensations that you will experience during these influences and movements of the palm of your hand.”
In the second series, the experimenter sequentially presents the same objects from the set, maintaining the duration of tactile recognition for 10 seconds and recording the subject’s verbal report in the protocol.
Study protocol two series of experiments can be presented on one common form.
At the end of two series of studies, the subject gives a self-report about how he orientated himself in the influences exerted on the palm of his hand, when it was easier to recognize objects and when it was more difficult.