Method simple moving average. Method of sliding average
The MOVING AVERAGE indicator is one of the most basic technical analysis tools for forex. It is a delayed line on a chart that smoothes the price effect. The reason for the lag is that the moving average averaries a certain number of periods on the chart.
The main function that the moving average gives is to provide the trader of the meaning of the total direction of the trend, and can also provide signals for upcoming price movements. In addition, the moving average can act as an important area of \u200b\u200bsupport and resistance. The reason for this lies in the fact that the price action tends to meet certain psychological levels on the chart.
Calculation of the moving average
Each moving average is subject to a calculation that gives an output signal that can be built on the price chart. Imagine that you have a simple sliding average with 5 periods on the EUR / USD chart. This means that each period on SMA will give you the average number of these 5 previous periods on the chart. Thus, if the price of EUR / USD begins to increase, SMA will begin an increase in 5 periods later. If the EUR / USD is 1.1000, 1.1100, 1.1200, 1.1300 and 1.1400 for five consecutive periods, then SMA 5-period will give us the value:
- (1.1000 + 1.1100 + 1.1200 + 1.1300 + 1.1400) / 5 = 1.1200
Therefore, the moving average is a delayed indicator - because a certain number of periods is necessary to show the value. As for this, the moving average can be installed for any period that you want.
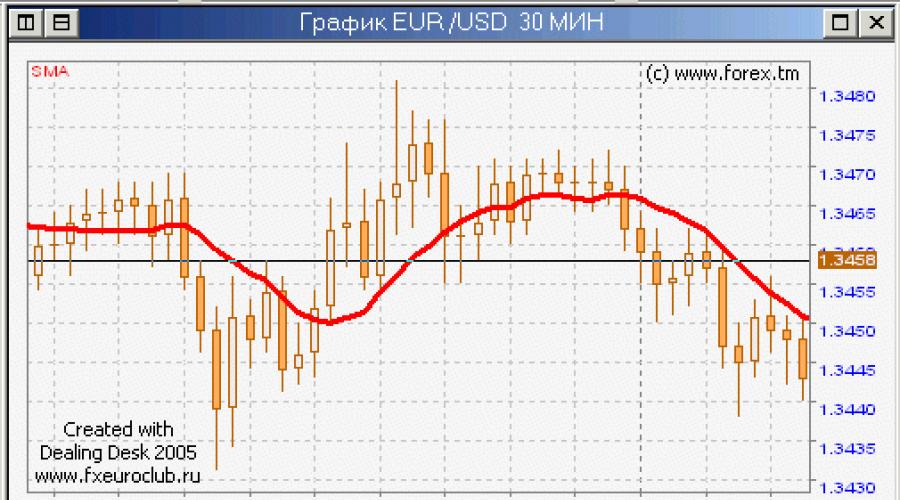
This is how the moving average looks like on the schedule:
This is a price schedule with two simple sliding averages. The blue line is a SMA 5 period, which takes into account 5 periods on the chart to show the value. The red line is a SMA 20 period, which takes into account 20 periods on the chart to show the value.
Please note that the red SMA 20-period is slower than the blue 5-period SMA. It is smoother and does not respond to small price fluctuations. The reason for this is that the SMA of the 20-period takes into account the larger number of periods. Thus, if we have a rapid price change, which lasts for one period, and then the price returns to normal course, the remaining 19 periods neutralize this oscillation. See the calculation below:
Let's say the price hangs by 1.50 for 10 periods. At the eleventh period, the price reaches 1.55 - a significant movement of 500 pips. Then during the next 9 periods, the price returns and remains at 1.50. What will show the SMA 20 period?
- (19 x 1.55 + 1.50) / 20 \u003d 1.5025 (SMA value of the 20-period)
Now let's say, the start of the price is 1.50 during the first period. Then, during the second period, the price reaches 1.55. Then, within the next three periods, the price returns and remains 1.50. What will show SMA 5 times?
- (4 x 1,55 + 1.5,50) / 5 \u003d 1,5100 (SMA 5-period value)
Thus, in the first case, we have a value of 1.5025, which is barely differentiate from the main price range of 1.50. In the second case, we have a value of 1.5100, which is 75 points more. Thus, SMA with a big period smoothes the price better and less reacts to individual bar oscillations.
Types of sliding averages
Depending on how moving averages are calculated, there are several different types of them. For example, some of the Moving Average lines measure a recent price effect to a greater extent than the past price effect, others consider all the price effect equally over the entire period. Let us now take a look at the most popular types of moving averages:
Simple Moving Average or SMA)
Above you saw the structure of the most common sliding medium - simple sliding average. It simply gives the average arithmetic periods on the chart.
Exponential Moving Average or EMA)
Exponential sliding average (EMA) is another moving average, which traders often use. It looks just like a simple sliding average on the schedule. However, the EMA calculation differs from the calculation of SMA. The reason for this lies in the fact that EMA makes a greater emphasis on later periods.
- M: Multiplier
- P: Current price
Previous EMA: Previous EMA value; If there is no previous EMA value, the value of the same SMA period is used.
Now we must calculate the multiplier. It refers to another formula:
- M \u003d 2 / N + 1
- M: Multiplier
- n: Relevant periods
- Let us now calculate the EMA 20 period. First we calculate the multiplier.
- M \u003d 2/20 + 1
- M \u003d 2/21
- M \u003d 0.095 (0,0952380952380952)
Now we will calculate the current EMA. Nevertheless, we will need the previous EMA value. For example, the previous EMA value is 1.40, and the current price is 1.38. The meanings we have, we will use in the formula:
- EMA \u003d M X P + (1 - M) x (Previous EMA)
- M \u003d 0.095
- P \u003d 1,38.
- Previous EMA \u003d 1.40
- EMA \u003d 0.095 x 1,38 + (1 - 0.095) x 1.40
- EMA \u003d 0.1311 + 0.905 x 1.40
- EMA \u003d 0.1311 + 1,267
- EMA \u003d 1,3981.
The multiplier we calculated determines the emphasis on recent periods. Thus, the more periods there are, the less emphasis will be, as it will cover more periods. Now let me show you on the chart than EMA differs from SMA:
This is an EUR / USD daily chart with red and blue sliding averages 50 times. Red is a SMA 50 period, and blue is an EMA 50 period. As we said, EMA and SMA are different, and they do not move together, because EMA focuses on later periods. Now look at the black ellipse and the black arrow on the chart. Please note that the candles in the ellipse are large and bulls, which indicates a strong price increase. This is when the blue EMA comes above red SMA, because the emphasis is more fascinating on these candles.
Weighted (Weighted Moving Average or WMA)
Weighted sliding average has a similar structure of the exponential moving average. The difference lies in the fact that WMA focuses on periods with a higher volume. This is how the 5-period WMA is calculated:
- WMA 5-period \u003d (P1 x V1) + (P2 x V2) + (P3 x V3) + (P4 x B4) + (P5 x V5) / (V1 + V2 + V3 + V4 + V5)
- P: Price of the corresponding period
- V: volume in the corresponding period
Thus, the higher the period of the period, the more emphasis will be made for this period. Look at the image below.
This hour schedule EUR / USD shows the rapid rise in prices for large volumes. We have two moving averages on the chart. The red line is a 50-period simple moving average, and the pink line is a 50-period of weighted sliding average value.
In the black ellipse, we see the rapid rise in prices. In the black square, we see that price increases is due to the high trading volumes of the EUR / USD pair. That is why WMA at that time switches above SMA - high volumes, and WMA focuses on higher volume readings.
Trend Analysis
The sliding medium (MA) indicators can help us determine the beginning and end of the trend. Trade method includes several signals that tell us when to be ready for entry and exit from the market. Let's talk about them yet ...
- The price crosses the line ma
- The most basic signal consists in the intersection of the price of the sliding average.
- When the price breaks up, we get a bullish signal.
- And if on the turn when the price breaks through the moving middle down, we get a bearish signal.
This is the 4-hour USD / JPY chart from January to February 2016, we have a 20-period SMA graph. The figure shows four signals caused by the price effect and the interaction of the moving average line.
In the first case, the price breaks the SMA of the 20-period in a bull direction. This creates a long signal. And in the subsequent price increase. The second signal on the chart is a bearish. Nevertheless, the signal is a false breakthrough, and the price is quickly returning above SMA. Then the price breaks the SMA 20 periods in a bear direction, creating a short signal. The next fall is quite strong and stable.
If you trade on this strategy, you must remember that in general, the more periods included in the moving average, the more reliable signal. And many traders who follow the simple sliding average system are very closely monitored for a 50-day moving average and 200-day sliding average line. However, when using a higher moving average, the lag of the sliding medium line to the action of the current price will also be greater. This means that each signal will come later than when we use a moving average with a smaller number of periods.
This is the same USD / JPY schedule, but this time we have a 30-period SMA on our chart together with the original 20-period SMA. Please note that the blue SMA 30-period isolates the fake signal. However, the signal for a strong bear trend comes later than on a 20-period SMA (red). Long signal at the end of the trend comes also later. Keep in mind that there is no optimal value of the moving midline that can be used in all markets or even on one.
Intersection of moving averages
The intersecting signal of the sliding average includes the use of more than one moving average. In order to obtain the intersection of moving averages, we must see that a faster sliding average breaks the slower moving average. If the transition is in a bull direction, we get a long signal. If the transition is in a bear direction, we get a short signal.
This is a monthly EUR / USD pair schedule for the period from 2007 to 2016. The blue line on the graph is the SMA 150 period. Please note that the EUR / USD price has tested the SMA 150-period as support. Two tests occurred in mid-2010 and in mid-2012. In mid-2014, the price fell to the SMA 150 period for a new test. Nevertheless, SMA was sharply broken in a bear direction, with the result that the price of EUR / USD fell to a 12-year-old minimum.
This is another example of a moving average on the daily chart of USD / JPY. The image shows a 200 day moving average line on the graph. The price breaks through a 200-day SMA, and then checks it as resistance. This suggests the importance of the 200-period SMA in the daytime timeframe.
Fibonacci trade and moving average
There is a psychological relationship between Fibonacci relationships and some sliding average values. Traders can use moving averages based on Fibonacci numbers to assist in the discovery of the dynamic area of \u200b\u200bsupport and resistance at the price schedule. Let's look at the example:
The image above shows the daily chart of GBP / USD from September 2013 to August 2014. The graph displays three simple moving averages, which corresponds to the following Fibonacci numbers:
- Blue: SMA 8
- Red: SMA 21-period
- Yellow: SMA 89
As you see, the periods of these SMA are taken from the well-known Fibonacci sequence:
1, 1, 2, 3, 5, 8, 13, 21, 34, 55, 89, 144, etc.
On the above schedule, we use a yellow simple sliding average 89 period as supporting a strong ascending trend. At the same time, the intersection of the blue 8 period and the Red 21 SMA period can be used for accurate points of entry and exit on potential trading positions. On our example, we have 5 potentially good trading conditions on the way up. When the price tests the yellow 89 SMA period as support and bounces up, a long signal occurs when blue and red SMA intersect up after rebound (green mugs). The output signal comes after the intersection occurs in the opposite direction (red circle).
Please note that after the last long transaction, the price decreases through the yellow SMA 89 period, which gives a strong signal of the reversal.
In all examples, we used simple moving averages, because they are among the most frequently used in Forex trading. However, trading strategies described above will work in the same way with other types of sliding averages - exponential, Volume Weighted, etc.
In all examples, we used simple moving averages, because it is usually used in the forex trading. Nevertheless, trading strategies would have worked the same way with various sliding average values \u200b\u200b- exponential, weighted, etc.
Conclusion
The MOVING AVERAGE indicator is one of the most important technical analysis tools for Forex.
There are various types of moving averages based on criteria for averaging periods. Some of the most widely used moving averages:
Simple moving average (SMA): This is a simple arithmetic average of the selected periods.
Exponential sliding average (EMA): it focuses on later periods.
Weighted sliding average (WMA): it focuses on periods with higher trading volumes
Sliding averages can be used to obtain signals input and output. Two main signals moving average:
- The price crosses the moving average
- Multiple intersection of moving averages
Some of the most important levels of the moving average:
- SMA with 50 period
- SMA with 100 period
- SMA with 150 period
- SMA with 200 period
Traders can be carried out with the addition of moving averages that respond to the well-known sequence of Fibonacci numbers. Some most used:
- 8-period SMA
- 21-period SMA
- 89-period SMA
.
Moving averageit refers to the class of indicators following the trend, it helps to determine the beginning of a new trend and its completion, at its angle of inclination, it is possible to determine the force (speed), it is also used as the basis (or smoothing factor) in a large number of other technical indicators. Sometimes called the trend line.
Formula of a simple moving average:
Where PI - market prices (usually take prices close, but sometimes use Open, High, Low, Median Price, Typical Price).
N is the main parameter - smoothing length or period(The number of prices included in the calculation of the sliding). Sometimes this parameter is called by the order of the sliding average.
Example of a sliding average:
with parameter 5.
Description:
The simple is the usual arithmetic average of prices for a certain period. It represents a certain equilibrium price indicator (equilibrium demand and supply in the market) for a certain period than shorter the moving average, the shorter the balance is taken. Averaging prices, it always follows with a certain lag for the main market trend, filtering small oscillations. The smaller the parameter (they say that in short), the faster determines the new trend, but at the same time makes more false oscillations, and vice versa than the parameter (they say long, the slower is determined by the new trend, but there is less than false oscillations.

Using:
Application of moving averagesquite simple. Moving averages do not predict changes in the trend, but only sign up for the trend already appeared. Since the moving averages are the following on the indicators, they are better to use them during the periods of the trend, and when there are no on the market, they become absolutely ineffective. Therefore, before using these indicators, it is necessary to carry out a separate analysis of the properties of a particular monetary pair. In the simplest form, we know several ways to use the moving average.
There is 7. basic methods of moving average:
- Determination of the part of trading with a moving average. If it is directed up, then you only make purchases, if down - then only sales. At the same time, the entry and exit points are determined on the basis of others. methods of moving averages (Including on the basis of a faster sliding).
- Return from the bottom up with a positive inclination of the price itself is considered as a signal for a purchase, turn from top to bottom with a negative slope of the price itself is considered as a signal for sale.
- Method of sliding averagebased on the intersection of its price sliding from top to bottom (with a negative slope of both) is considered as a signal for sale, the intersection of its price sliding average From the bottom up (with a positive slope of both) is considered as a purchase signal.
- The intersection of the long short bottom is considered as a signal to purchase and vice versa.
- Moving medium with round periods(50, 100, 200) is sometimes considered both sliding levels and resistance.
- Based on what sliding are directed upwards, and which downs are defined which as long as the downward (short-term, medium-term, long-term).
- The moments of the greatest discrepancies of two medium with different parameters understand as a signal to a possible change in the trend.
Disadvantages of the method of moving average:
- Using method for trading onloading at the entrance and on the exit from usually very much, so in most cases most of the movement is lost.
- In and especially in the side of the saw, gives a lot of false signals and leads to losses. At the same time, a trader selling on the basis of a simple sliding cannot skip these signals, since each of them is a potential input signal to the trend.
- At the entrance to the calculation, the price differed from the price level in the market changes greatly. At the exit of this price, at the rate of the sliding, a strong change occurs again. This effect A. Elder called "bad dog barks twice."
- One of most serious shortcomings of the moving average methodIt is that it gives the same weight as more renovations, as well as older prices, although it would be more logical to assume that new prices are more important, as they reflect the market situation closest to the current moment.
Note 1: The market is able to better use a shorter moving, on the market to better use a longer sliding, as the feeding less than false signals.
Note 2: It has quite a lot of more efficient modern variations: an exponential sliding average, weighted sliding average, there are also a number adaptive moving averagesAMA, KAMA, JURIK MA, etc.
Risk Warning: We do not recommend using no indicators on real accounts without pre-testing their work on a demonstration account or testing as a trading strategy. Anyone, even the best indicator, applied incorrectly gives many false signals and, as a result, can bring significant losses in the trade process.
One of the easiest ways to solve this problem is to use a moving average price (MOVING AVERAGES).
The moving average method allows the trader to smooth and quickly determine the direction of the current trend ,.
Types of moving averages
There are three different types of moving averages that differ in calculation algorithms, but they are all interpreted equally. The difference in calculations is the weight, which is attached to prices. In one case, all prices may have the same weight, in another more recent data have more values.
The three most common types of moving averages:
- simple)
- linear Weighted (Linear Weighted)
- exponential (Exponential)
Simple moving average (SMA, SIMPLE MOVING AVERAGE)
This is the most common method for calculating moving average prices. It is necessary to simply take the amount of closing prices for a certain period and divided by the number of prices used to calculate. That is, it is the calculation of a simple medium-graded value.
For example, for a ten-day simple moving average, we must take the closure prices over the past 10 days, fold them together and divide by 10.
As you can see in the figure below, the trader can make moving averages more smoothly, simply increasing the number of days used (hours, minutes) to calculate. A large period for calculating the moving average is usually used to display a long-term trend.

Many doubt the feasibility of using simple moving average prices, since each point has the same value. Critics of this method of calculation believes that more recent data should have greater weight. It was such arguments that led to the creation of other types of moving averages.
Weighted sliding average (WMA, Linear Weighted Average)
This variant of the moving average price is the rarely used indicator of three. Initially, it should have struggled with the lack of calculating the simple moving average. To construct a weighted moving average, you need to take the amount of closing prices for a certain period multiplied by the sequence number, and divide the resulting number to the number of multipliers.

For example, to calculate a five-day weighted moving average, you need to take the current price of the closure and multiply it to five, then take yesterday's closing price and multiply it to four and so continue until the end of the period. Then these values \u200b\u200bmust be folded and divided into the sum of multipliers.

Exponential sliding average (EMA, EXPONENTIAL MOVING AVERAGE)
This type of moving average represents the "smoothed" version of WMA, where more values \u200b\u200bare attached to the latest data. This formula is considered more effective than that that is used to calculate the suspended moving average.
You do not need to thoroughly understand how all types of moving average are calculated. Any modern shopping terminal will build you this indicator with any settings.
The formula for calculating the exponential moving average is as follows:
EMA \u003d (closing price - EMA (previous period) * Multiplier + EMA (previous period)
The most important thing is that you need to know about the exponential sliding average - it is more susceptible to new data in comparison with a simple moving average. This is a key factor in why the exponential calculation option is becoming more popular and today is used by most traders.
As you can see from below, EMA with a period of 15 reacts faster to price changes than SMA with the same period. At first glance, the difference seems not significant, but this impression is deceptive. Such a difference can play a key role during real trading.

Definition of trend on sliding average
Moving averages are used to determine the current trend and the moment of its reversal, as well as to find resistance and support levels.
Moving averages allow you to very quickly understand which way the trend is currently directed at the moment.
Look at the bottom image. Obviously, when the moving average moves under the price schedule, you can confidently say - trend ascending. And on the contrary, when the moving average is above the price schedule, the trend is considered descending.

Another way to determine the direction of the trend is to use two moving averages with different periods for calculation. When the short-term average is over long, the trend is considered ascending. And on the contrary, when the short-term average is under the long-term, the trend is considered descending.
Definition of the reversal of a trend on a moving average
The turn of the trend on the moving average is defined in two ways.
The first is when the average crosses the price schedule. For example, when the moving average with a period of 50 crosses the price schedule, as in the image below, this often means a trend change from ascending to the downward.

Another option to receive signals about possible reversals of the tendency is to track the intersection of moving medium, short-term and long-term.
For example, in the bottom image you can see how the moving average with a period of calculation 15 crosses the moving average with a period of 50 from the bottom upwards, which signals the beginning of the upward trend.

If the periods used to calculate the average relatively small (for example, 15 and 35), their intersections will signal the short-term trend reversals. On the other hand, periods are used significantly more to track long-term trends, for example 50 and 200.
Moving medium as levels of support and resistance
Another fairly common way to use moving average is to define support and resistance levels. For this purpose, moving averages with large periods are commonly used.
When the price is selected to the support line or resistance, it is quite high like its "rebound" from this level, as can be seen in the image below. If the price breaks through the long-term moving average, then the likelihood of continuing price movement in the same direction is high.

Output
Moving averages in technical analysis are one of the most powerful and at the same time simple tools for market analysis. They allow the trader to quickly determine the direction of long-term and short-term trends, as well as levels of support and resistance.
Each trader uses its settings for calculating moving averages. Much here depends on the style of trading and on what financial market they apply (market, currency exchange, etc.).
Moving medium helps technical analysts to remove the so-called "noise" of daily price fluctuations from the graphics. Traditionally moving averages are called trend indicators.
Practical modeling of economic situations implies the development of forecasts. Using Excel funds, such effective forecasting methods can be implemented as: exponential smoothing, regression constructing, moving average. Consider the use of the moving average method.
Use moving averages in Excel
The moving average method is one of the empirical methods for smoothing and predicting time series. Essence: The absolute values \u200b\u200bof the speakers are changed to the middle arithmetic values \u200b\u200bat certain intervals. The choice of intervals is carried out by the method of sliding: the first levels are gradually cleaned, the following - are included. As a result, a smoothed dynamic range of values \u200b\u200bis obtained, which allows you to clearly trace the tendency of changes in the parameter under study.
The time series is a set of x and y values \u200b\u200brelated to each other. X - time intervals, constant variable. Y is the characteristic of the studied phenomenon (the price, for example acting during a certain period of time), dependent variable. With the help of a moving average, you can identify the nature of the changes of the y value in time and predict this parameter in the future. The method is valid when the trend in the dynamics is clearly traced for values.
For example, you need to predict sales for November. The researcher selects the number of previous months to analyze (the optimal number of M members of the moving average). The forecast for November will be the average value of the parameters for the last month.
A task. Analyze the revenue of the enterprise for 11 months and make a forecast for 12 months.
We form the smoothed time series by the method of sliding average by means of the function of the SRVNA. We find the average deviations of the smoothed time series from the specified time series.


Relative deviations:

Medium quadratic deviations:

When calculating deviations, they took the same number of observations. This is necessary in order to conduct a comparative analysis of errors.
After making tables with deviations, it became clear that to prepare the forecast using the method of moving average in Excel on the trend of changes in the enterprise's revenue, a preferably model of a two-month moving average. She has minimal forecasting errors (in comparison with three and four months).
The forwarding value of revenue for 12 month - 9,430 cu
Application of add-on "analysis package"
For example, take the same task.
On the Data tab, we find the "Data Analysis" command. In the dialog box that opens, select the "moving average":

Fill. The input interval is the initial values \u200b\u200bof the time series. The interval is the number of months included in the calculation of the moving average. Since we will first build a smoothed time series according to two previous months, enter the number 2. The output interval is the range of cells to remove the results obtained.

After selecting the checkbox in the "Standard Error" field, we automatically add a column to the table with a statistical estimate of the error.
Similarly, we find a moving average for three months. Only the interval (3) and the output range changes.

Comparing standard errors, we are convinced that the model of the two-month moving average is more suitable for smoothing and forecasting. It has smaller standard errors. The forwarding value of revenue for 12 month - 9,430 cu
Forecasts on the method of moving average simply and efficiently. The tool accurately reflects changes in the basic parameters of the previous period. But it is impossible to go beyond the limits of known data. Therefore, for long-term forecasting, other methods are applied.
The average sliding value refers to the category of analytical tools, which, as it is customary, is "followed by a trend." Its purpose is to allow you to determine the time of the beginning of a new trend, as well as warn about its completion or turn. Methods of the moving average are intended to track trends directly in the process of their development, they can be considered as curved trend lines. However, methods of moving average are not intended to predict movements in the market in the sense in which it allows you to make a graphical analysis, since they always follow the dynamics of the market, and not ahead of it. In other words, these indicators, for example, do not predict the dynamics of prices, but only react to it. They always follow the price movements in the market and sign up to the beginning of a new trend, but only after it appeared.
Building a moving average is a special method of smoothing indicators. Indeed, in averaging price indicators, their curve is noticeably smoothed and to observe the trend of market development becomes much easier. However, at its very nature, the moving average as if lags behind the market dynamics. The short-term moving average more accurately transmits the price movement, the longer, i.e. Calculated for a longer interval. The use of short-term moving average allows you to reduce the lag in time, but it is impossible to completely eliminate it using any method of moving average.
Simple moving average, defined as the arithmetic value, is calculated according to the following formula, provided that m. - odd number:
where u, - the actual value of the level; m.
- the number of levels included in the smoothing interval ![]() - current level of speakers; i. - the sequence number of the level in the smoothing interval; r - with odd m.
has the meaning p \u003d (m.
- 1)/2.
- current level of speakers; i. - the sequence number of the level in the smoothing interval; r - with odd m.
has the meaning p \u003d (m.
- 1)/2.
Smoothing interval, i.e. The number of levels included in it m. Defined according to the following rules. When it is necessary to smooth minor, indiscriminate fluctuations, the smoothing interval takes great, if it is necessary to preserve more minor fluctuations and free themselves from periodically repetitive emissions - the smoothing interval is usually reduced.
The simple moving average method is usually used in cases where the timing schedule is a straight line, since the dynamics of the studied phenomenon is not distorted.
In the event that the trend of the row is clearly non-linear and it is desirable to keep minor fluctuations in the dynamics of values, this method is not used, since its use can lead to significant distortions of the process under study. In such cases, weighted moving average or exponential smoothing methods are used.
Practice shows that the method of a simple sliding average allows you to develop an objective strategy and clearly defined rules, for example, in the field of trade. That is why this method is based on many computer systems for commercial organizations. How can I use the moving average method? The most common ways to apply a moving average are.
1 . Mapping the value of the current price with the moving average used in this case as a trend indicator. So, if prices are above the 65-day moving average, then the market has an intermediate (short-term) ascending trend. In the case of a longer-term trend, the price must be higher than a 40-week moving average.
2 . Using a moving average as a level of support or resistance. Closing the prices above this moving average serves as a "bullish" signal, the closure below it is "bearish".
3 . Tracking the sliding medium strip (another frequently used name - envelope). This strip is limited to two parallel lines, which are located on a certain percentage above and below the moving average curve. These boundaries can serve as support or resistance level indicators, respectively.
4 . Observation on the direction of inclination of the moving average curve. So, if after a long lift it aligns or turns down, it can be a "bear" signal.
5 . Another simple observation method consists in building a trend lines on a moving average curve. It can also be advisable to use a combination of two moving averages.
Microsoft Excel has a function Moving average (MOVING AVERAGE), which is usually used to smooth out the levels of the empirical time series based on the method of a simple moving average. To call this feature, you must select the Tools ^ Data Analysis menu command (Service1 * Data Analysis) command. The Data Analysis window will be revealed on the screen, in which you should select Moving Average. As a result, the MOVING AVERAGE dialog box, shown in Fig, will be displayed. 11.1.
In the dialog box Moving average The following parameters are set.
1. INPUT RANGE - The range of cells containing the values \u200b\u200bof the test parameter is introduced into this field.

2. Labels in First Row (Tags in the first line) - This check box is set in the event that the first line / input column contains a header. If the title is missing, the checkbox should be reset. In this case, standard names will be automatically created for the output range.
3. INTERVAL (interval) - This field introduces the number of M levels included in the smoothing interval. Default v \u003d 3.
4. Output Options - In this group, in addition to specifying the range of cells for output in the Output Range field, you can also need to automatically build a schedule, for which you need to check the Chart Output option checkbox (graphics), and Calculate standard errors, for which it is necessary to check the Standart Errors option checkbox (standard errors).
Consider a specific example. Suppose, for the specified period (1999-2002), it is necessary to identify the main tendency to change the actual volume of production and the nature of seasonal fluctuations of this indicator. The data for example is presented in Fig. 11.2. In fig. 11.3 Displayed by the MOVING AVERAGE function (moving average) values \u200b\u200bof smoothed levels and values m \u003d 3.